
I don’t really like articles (of any genre) that don’t answer the core question and so we’ll exorcise those demons right now. Is PayPal (NASDAQ: PYPL) a good investment following strong second-quarter results? Honestly, I don’t know. Certainly, the company has shown improvements but that alone doesn’t necessarily drive robust confidence toward PYPL stock.
Table of Contents
So, should investors just sit on the sidelines and wait for clearer signals? You could but that approach doesn’t actually solve the question you’re asking. Think about it — why do people read handicapping previews of rival sports matchups? Obviously, they want to know which team has the better chance of coming out victorious, along with the likelihood of other wagerable events.
No handicapper says, wait until the quarterback throws for five touchdowns. As far as I’m aware, you have to place your bets before the game begins. And so it is with the equities market. If you wait for PayPal to deliver on those clear financial signals, it’s almost certain that PYPL stock will digest the news and swing higher, thus forcing you to pay an information premium.
My thesis, then, is that while I don’t know where PayPal stock may end up in the long run, there’s an opportunity for bullish speculators to potentially scalp some quick profits over the next three weeks. It comes down to the nature of path-dependent pricing.
Path Dependency is the Key to Trading PYPL Stock
I know that my articles are “unusual” because they dive into quant analytics that are not commonly discussed in the financial publication ecosystem. But I’ll make it super-simple here: what you need to understand is that path dependency is the key to trading PayPal stock (or any other major public security).
What do I mean by path dependency? Basically, the general direction that a ticker moves toward is influenced by immediate events. If you want to know more, this concept aligns with the application of Markov chains; that is, the probability of the future state occurring depends on the current state.
Let’s consider path dependency using football terms. At the beginning of a contest between two evenly matched teams, it’s difficult to know which one will likely emerge victorious. But the team that scores the first touchdown often enjoys a momentum swing, thus raising the probability (all other things being equal) of winning the matchup.
Of course, a great game ebbs and flows — thus shifting the probability of who goes home with the “W.” This shifting is the evidence of path dependency. The odds of victory are heavily influenced by or dependent on key events that occur within the game.
So, when I discuss a specific options trading idea for PYPL stock or any other name, I’m not just issuing an empty opinion or appealing to authority (i.e. citing analyst price targets). Instead, I’m looking at material events and how they have historically altered outcomes.
Check out a pro sports broadcast: you’ll often hear analysts say that the team that has scored first or the team that last has control of the ball in the final quarter is likely to win. That’s not an opinion — that’s statistical data. And while past trends aren’t guaranteed to repeat in the future, they provide an inductive framework to better understand what is likely to happen next.
Proof of Concept for PayPal Stock
An excellent proof of concept is my last StockEarnings article that I published featuring PYPL stock. On May 20, I wrote that anyone who wants to “speculate may consider the 45/44 bear put spread expiring June 12.” On that expiration date, PYPL closed at $41.53. In hindsight, I should have been more aggressive rather than playing it safe with a $44 downside target.
Nevertheless, the important takeaway is that I didn’t conclude the story with a wait-and-see approach. Instead, I had a good idea that PayPal stock would tumble.
How did I know that? At the time of publication, PYPL printed only three up weeks in the prior 10 weeks, leading to a downward slope. Under this 3-7-D sequence, the next 10 weeks historically has led to a subpar performance relative to a random hold of the ticker.
Of course, I didn’t know with absolute certainty that PYPL stock would fall. I just relied on the data that suggested that when PayPal flashes this distinct quant structure, the near-term outcome tends to be poor. In other words, I just played the odds.
Now, this doesn’t meant that I’m always right; indeed, I’ve had more than my fair share of clunkers. But what you can expect from me is that I’m always using the same path-dependent model to illuminate my decisions. If I was bearish on PYPL stock, that’s because the data tilted the probabilistic odds to the downside.
But now? I’m saying the opposite. For the next few weeks, the data suggests that PayPal stock represents an upside opportunity.
What Changed? The Market Structure
Just because a team scored first doesn’t always mean they’ll end up winning the game. If the opposing team levels terms, suddenly, momentum shifts in the other direction. That’s the quant narrative that we have with PYPL stock.
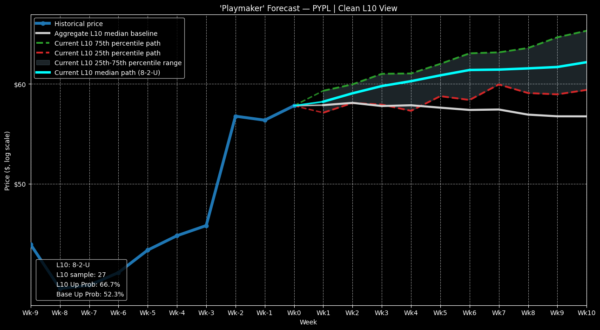
In the last 10 weeks, only two of the sessions were negative. Ordinarily, you might assume that this 8-2-U sequence would be begging for a correction — and I would typically agree with you. However, when you look at the data for PayPal stock, there’s limited historical justification for pessimism.
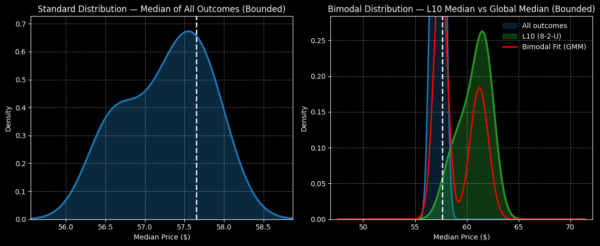
Running a forward-looking Markov simulator on PYPL when it flashes the 8-2-U sequence, the median expectation over the next three weeks is an endpoint price of nearly $60. If we assume a similar trend moving forward, the 58/60 bull call spread expiring Aug. 21 is (in my opinion) compelling.
Should PayPal stock rise through the $60 strike at expiration — which is a very realistic proposition based on past empirical data — the maximum payout is 115%. That means you’ll put to risk a $93 net debit with the aim of collecting a profit of $107.
However, the mathematical centerpiece is the $58.93 breakeven price. Right now, Wall Street assigns a probability of profit of only 39.2% using a path-independent model. Essentially, this implied probability stems from a constrained output of the Black-Scholes model. In other words, the output can only incorporate the limitations of the defined formula, making it independent of external market-influencing factors.
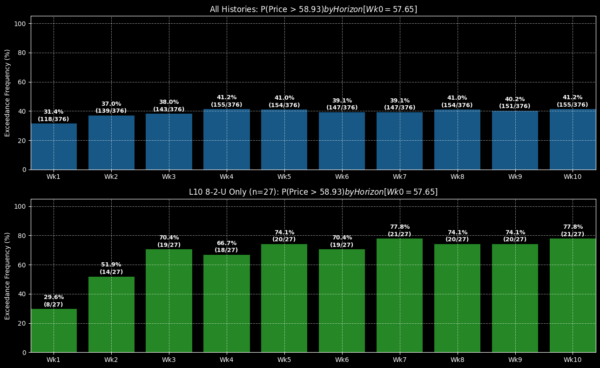
In contrast, by using a path-dependent model, we can see if the empirically observed probabilities line up with Black-Scholes (they usually don’t). For example, of the 27 times that the 8-2-U signal has flashed since January 2019, PYPL stock has exceeded the equivalent of the $58.93 breakeven price a total of 19 times at the end of week 3 (Aug. 21). If so, the conditional probability of profit could be 70.4%.
Again, I have to be clear that just because the above signal has historically demonstrated an upward bias does not guarantee that the same trend will materialize over the next three weeks. But if you’re playing the odds, I would take a long look at the 58/60 bull spread for PayPal stock.
Leave a Reply