
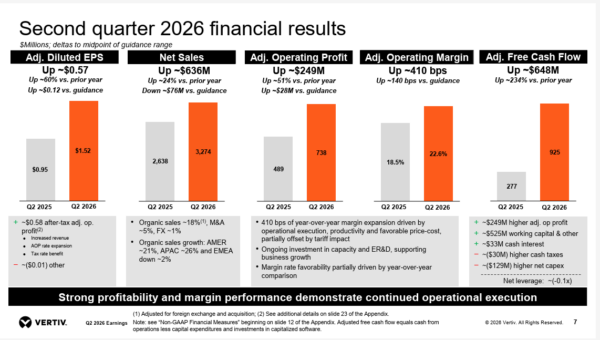
Vertiv Holdings (NYSE: VRT) just delivered one of its strongest quarters on record. Second-quarter net sales climbed 24% to $3.27 billion, while adjusted diluted EPS jumped 60% to $1.52. Free cash flow more than tripled. Management raised full-year guidance across every major metric.
Table of Contents
On paper, that should have been exactly the kind of print that would send VRT higher. But the stock dropped approximately 15% immediately after the report before closing the week with a 6% gain in the July 31 session.
That continues a pattern that’s been in place since mid-May. VRT is down approximately 35%, pushing the stock near its 200-day moving average for the first time in the last 12 months. That disconnect between fundamentals and price action is the real story here. Investors are no longer rewarding Vertiv simply for beating estimates. They want to know that the AI infrastructure buildout can keep compounding without cracks showing.
There’s also the question of valuation. VRT is priced for perfection at roughly 54 times earnings. The bull case rests on free cash flow growth outrunning the multiple over time. The bear case is more complicated: rising project complexity, supply chain interdependencies and a growing political backlash against data center construction.
Vertiv itself flagged some of these risks in its own release. Here’s what the numbers say, what management admitted, and what the chart is signaling for VRT heading into the second half of 2026.
Free Cash Flow Is the Key to Vertiv’s Premium Valuation
Earnings growth and stock price growth go hand in hand. But when it comes to Vertiv, cash is king. Vertiv generated $925 million in adjusted free cash flow during the quarter, up 234% year-over-year, with free cash flow conversion exceeding 150%. That’s an extraordinary rate of cash generation relative to earnings, and it’s the metric that ultimately justifies a premium multiple.
A 54x earnings multiple looks stretched in isolation. But when a company is converting more than its net income into actual cash — while simultaneously funding acquisitions, capital expansion, and a net cash balance sheet — the valuation math shifts. Vertiv ended the quarter with $5.6 billion in liquidity and a net cash position, giving it the flexibility competitors lack.
This is the crux of the investor psychology at play. The market has priced Vertiv as an AI infrastructure bet rather than a legacy industrial name. But if free cash flow keeps compounding at anywhere near this pace, today’s multiple could look reasonable in hindsight.
Raised 2026 Guidance Reinforces AI Infrastructure Demand
In addition to delivering a strong quarter, Vertiv raised the bar for the rest of 2026. It raised its full-year net sales guidance by $250 million, adjusted diluted EPS guidance to $6.70 at the midpoint, and adjusted free cash flow guidance climbed to $2.5 billion. Third-quarter guidance calls for a 45% year-over-year (YOY) increase in adjusted diluted EPS.
Raising guidance this aggressively, one quarter after already guiding for the year, signals management sees durable demand, not a one-time pull-forward. CEO Giordano Albertazzi pointed to strengthening pipelines across every region, including a return to growth in EMEA, as evidence that the AI power and cooling buildout still has room to run.
Supply Chain and Data Center Risks Could Challenge Growth
Not everything about the report was clean. Vertiv disclosed that Q2 revenue reflected “minor timing shifts” tied to temporary supply chain congestion and increasingly complex, multi-phased project execution. Management said the delayed revenue should show up in the back half of the year, but acknowledged an ongoing learning curve as deployments scale in size and complexity.
That admission matters more than its careful phrasing suggests. As data centers evolve toward denser architectures — including the 800 VDC systems highlighted in Vertiv’s investor materials — execution risk rises alongside opportunity.
That’s a practical risk. There’s a different risk on the regulatory front. Specifically, there is growing local and political pushback against new data center construction in some markets, and the bull case depends on flawless execution through a genuinely harder operating environment.
Vertiv Stock Tests Key Technical Support After Earnings
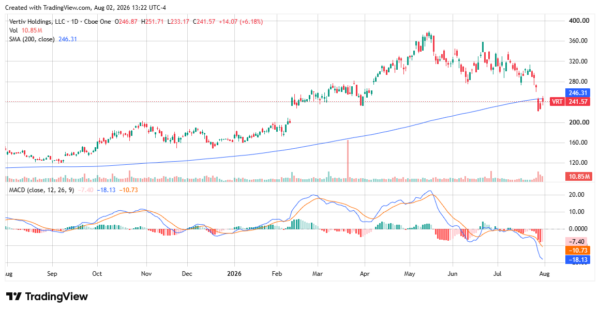
The chart tells a cautionary story. VRT has fallen from roughly $380 in May to $241.57, right at its 200-day simple moving average of $246.31. The MACD remains in negative territory, at -18.13, well below its signal line — a sign momentum has been bearish for weeks.
The RSI sits near 34, approaching oversold territory but not yet there. That leaves room for further downside before a technical bounce becomes likely. A decisive break below the 200-day average would open the door to a retest of the October 2025 breakout zone near $200. Bulls need to reclaim $260-$270 to repair the technical damage.
The Investment Case for Vertiv Stock After Earnings
Vertiv’s fundamentals are firing on all cylinders: record free cash flow, raised guidance, and a fortress balance sheet. That combination is what keeps the bull case alive despite a rich valuation. But the stock’s post-earnings drop shows the market is pricing in real risk — from supply chain complexity to political friction around data centers.
The next two quarters will be the real test. If Vertiv converts its backlog into revenue without further timing slippage, the current pullback may prove to be a buying opportunity. If complexity keeps colliding with execution, a 54x multiple leaves little margin for error.
Leave a Reply