
While AI semiconductor plays make all the headlines, smart speculators know that throwing some money at stable powerhouses like Lowe’s (NYSE: LOW) can be a shrewd opportunity. Basically, the framework is that undergirding LOW stock is a reliable — many would say irreplaceable — business. As such, the overall sentiment regime governing LOW facilitates a certain level of relative predictability.
Table of Contents
In options trading, this predictability is gold. That’s because quantitative-minded traders must deploy rules-based trading as a default. While this process sounds advanced compared to market participants trading on vibes and internal courage (i.e. delusions of grandeur), it’s also susceptible to presuppositional failures.
Basically, all quant models are brittle to varying extents. Suppose that a model works elegantly in a bull market — but can the same be said about a bear market or a consolidatory cycle? Often, the answer is no, which necessarily means that quants are probabilistic entities.
Does this mean that it’s better to analyze LOW stock using fundamental or technical analysis? In the way that these methodologies are commonly practiced in the financial publication sector, I would answer that these frameworks are the most brittle.
For example, a common literary tool would be to cite Lowe’s year-over-year revenue growth rate of 10.2% and declare that this strong top-line expansion should continue into the future, making LOW stock a good buy. My question would be, how do you know that this growth rate isn’t already integrated into the share price? The answer is they don’t.
In the case of technical analysis, an author might see a cup-and-handle formation appear in the daily candlestick chart, suggesting that this pattern is a buy signal. My question would be, what is the base rate of this pattern? If LOW stock only printed this pattern two times, a single success story doesn’t tell us much.
Fortunately, Lowe’s business is a durable one. Therefore, if we find a more objective framework, we can theoretically bank on the general predictability to trade LOW stock.
Explaining the Theory Behind LOW Stock
Modern equity markets are dominated by algorithmic, rules-based trading — it basically has to be this way. Consider the paradigm shift that has occurred in recent years. Institutional heavy-hitters are no longer competing in terms of milliseconds. Instead, they’re operating in the realm of nanoseconds (billionths of a second). If you even blink, you’re late when you’re competing in the elite tier.
As an aside, that’s why I find finpub outlet’s declaration of a security being undervalued as laughable. Trying to find meaning in a single block of unusual options activity is even more absurd. By the exact moment that critical information becomes public, these advanced algorithms have already traded the news — and options market makers have adjusted their books to stay delta-neutral.
I’m sorry but you’re not getting more educated by reading your typical finpub article. Whatever insight that has been published has likely been digested seven ways to Sunday. So, does that mean retail traders are hopelessly at a disadvantage? If you play the information latency game, you absolutely are. But if you play the distributional probability game, you might have a chance.
Since we know that algos dominate equities trading, it makes sense that the balance of order flow influences the distribution of future outcomes. For example, a security that has suffered an extensive bearish cycle may be more prone to positive mean reversion because the algos interpret this particular microstructure as a discounted opportunity.
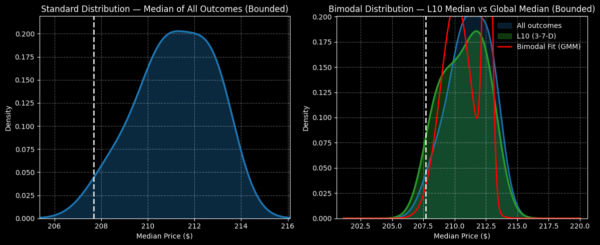
Let’s consider Lowe’s stock. Over the last 10 weeks, LOW has printed only three up weeks, leading to an overall downward slope across the period. Conditioned for this 3-7-D sequence — which has flashed 32 times on a rolling basis since January 2019 — the ticker’s 10-week forward distribution would be expected to land between $205 and $216 (assuming a starting price of $207.68), with probability density peaking around $212.
To be fair, this range is hardly any different from the random baseline, where LOW stock would be expected to land between $205.80 and $216 over the next 10 weeks. A peak probability density of $211 doesn’t immediately justify playing the 3-7-D signal.
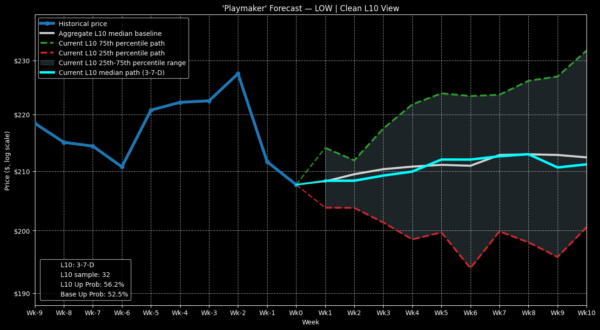
However, the performance variance isn’t orderly and linear. Instead, there’s a noticeable pop in week 5 and week 6 following the flashing of the signal that could be exploited by debit-side speculators.
Narrowing Down a Bull Spread
One of the options trades that make logical sense assuming the validity of the above model is the 200/210 bull call spread expiring Aug. 21. History has demonstrated that on week 6 following the flashing of the 3-7-D signal, the median outcome lands at around $212.
What’s most compelling, though, is this bull spread’s breakeven price of $206.80. Right now, the market is assigning a probability of profit (the odds that LOW stock reaches the breakeven price) of 51.5%. This calculation stems from the Black-Scholes model, which takes implied volatility and gauges the distance (in standard deviations) between the spot price and the target threshold, assuming a risk-neutral, log-normal distribution of outcomes.
In a way, then, the Black-Scholes model is deterministic. By feeding it inputs within a fixed formula, a specific probability of profit is spat out. My contention is that I don’t think you can assume fixed formulas in the equities market. Instead, as I mentioned, the current order flow balance likely influences future outcomes.
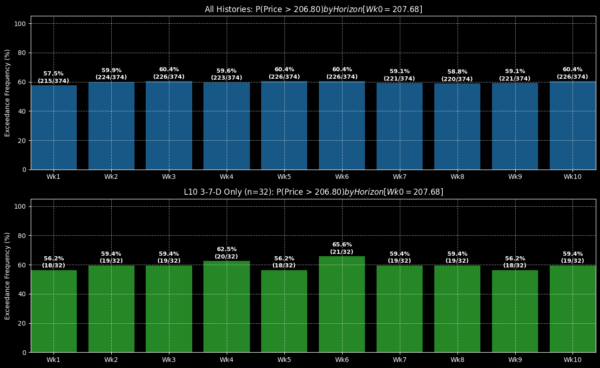
If we shift over to an empirical model, we know that out of the 32 times that the 3-7-D signal has flashed, Lowe’s stock has reached the breakeven price of $206.80 21 times on week 6. Using simple arithmetic, the empirical probability of profit should actually be 65.6%.
To be sure, the 200/210 bull spread is expensive, requiring a net debit of $680 per spread. Moreover, the maximum payout is just a little over 47%. Undoubtedly, you’re paying a premium for high probability, with the standard Black-Scholes model assigning better-than-coin-toss odds.
Technically, though, if you look at LOW stock not from the lens of a parametric (fixed) formula but from an empirical, non-parametric framework, the aforementioned options spread is cheap. While you’re paying for 51.5% odds of breakeven, you might actually be getting 14.1 percentage points added to your ledger for free.
Leave a Reply