
Palantir Technologies (NASDAQ: PLTR) arguably ranks among the most difficult tech names to figure out. Sure, there’s the whole big data narrative, along with artificial intelligence, which has driven PLTR stock to incredible heights. However, the problem is that investors are clearly looking for more substance out of the name, leading to skepticism about whether it can maintain its lofty premium.
Table of Contents
Just look at what happened in Palantir’s latest earnings disclosure. For the first quarter, the company posted earnings per share of 33 cents on revenue of $1.63 billion. These figures easily beat out analysts’ expectations for EPS of 27 cents against a top-line expected view of $1.54 billion. However, it’s also fair to point out that robust earnings performances have been par for the course.
Subsequently, on the day of the disclosure, PLTR stock popped higher. Unfortunately, the day after saw a sizable decline in market value. Overall, the results have been unimpressive. In the past month, PLTR incurred an 8.47% loss. On a year-to-date basis, the security is down roughly 25%.
In part, what appears to be happening is a broader sense of diminishing returns. For example, the upcoming Q2 report should show continued financial expansion, with EPS targeted at 33 cents and revenue at $1.81 billion. However, the market is signaling that it’s not enough to ink robust growth metrics. The improvements need to be that much more substantial to satisfy investors, who again are increasingly uncomfortable with the hot premium.
Under this environment, traders need to be more tactical with PLTR stock. You often see these fluff pieces on PLTR stock talking about AI and other narratives — as if this stuff hadn’t already been priced into the security!
It likely has, and the volatility skew is evidence of this.
Hesitation Among the Smart Money Presents an Interesting Case for PLTR Stock
By definition, the volatility skew identifies implied volatility (IV) across the strike price spectrum of a given options chain. Since IV reflects the expected kinetic range of a security at the affected strike price, a higher volatility reading effectively represents greater demand for hedging the implied movement.
Yes, this sounds like a complicated definition — and it is complicated, which is part of the reason why I’m not a big fan of the (deliberately) opaque nature of options education. Basically, the skew represents an insurance market. On any given day, a heavily traded stock would be expected to move either in a net positive or negative direction.
With options, smart money traders can either protect themselves from the risk of a catastrophic loss or they can lever up a speculative bullish position — essentially covering upside risk. In hesitant markets, sophisticated players may end up hedging both sides.
That’s about the situation that’s happening with PLTR stock. For the June 5 expiration date, the dominant expression is geared toward downside protection. You’ll notice that for the lowest out-the-money strike prices, put IV swings sharply northward. This dynamic implies protection against unexpected volatility.
However, the right-side tail is longer, implying careful exposure to upside convexity. Generally, the shape of the skew — especially it being flat for strikes near the spot price — indicates that the smart money doesn’t believe in wild drama for Palantir stock. Still, if something should happen positively, traders don’t want to be caught flat-footed.
An important caveat that needs to be declared is that the smart money isn’t necessarily prescient. Yes, these sophisticated players are buying insurance — but that doesn’t always mean that a car crash is more likely to occur. Right now, even the most seasoned traders don’t know what to exactly make of PLTR stock.
That’s where we can use induction and triangulate a potentially successful transaction.
Playing the Numbers Game with Palantir Stock
One of the tempting reasons why people trade PLTR stock is its high 60-month beta of 1.52. Essentially, this metric tells us that Palantir is considerably more volatile than the benchmark S&P 500. However, this stat is also an aggregate datapoint, meaning that PLTR isn’t always guaranteed to be as volatile as the beta implies. On some days, the volatility could be worse, or it could be muted.
In other words, we’re not interested in trading Palantir stock randomly; instead, we want to trade it deliberately. More to the point, we only want to trade it under conditions and time periods that are favorable to us. Based on the numbers, I believe we are in such a scenario.
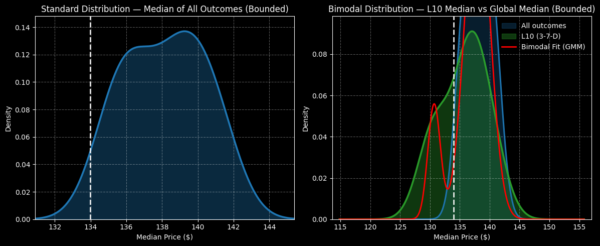
In the past 10 weeks, PLTR stock has printed only three up weeks, thereby leading to an overall negative slope. Under this 3-7-D sequence, we would expect the next 10 weeks to create a forward distribution ranging between $120 and $150 (assuming a starting point of $133.99).
Where did this distribution come from? Since PLTR’s public market debut, there have been 17 instances of the 3-7-D signal on a rolling basis. Using an inductive algorithm, we can plot an expected median pathway based on prior observations of this signal.
However, from a sequential week-to-week basis, we would anticipate PLTR stock to be incredibly choppy. Statistically, it’s only within the first three weeks that Palantir has demonstrated a tendency of rising. With prices expected to cluster around $140 at the third week (if the inductive observation is to repeat itself), this price level represents a logical target.
With that in mind, I’m looking at the 138/140 bull call spread expiring June 5. If Palantir stock rises through the $140 strike at expiration, the maximum payout would be roughly 111%. While it’s not the greatest payout by magnitude, you would only be putting a net debit of $95 per spread at risk.
Some might question the near-term expiry, which is understandable. However, having a long expiration date isn’t necessarily safe for a debit-based trade. That’s because the stock in question could easily fall out of the money while you wait for the spread to expire.
No, the inductive methodology used to calculate the trade above isn’t foolproof. But in a non-deterministic system, it’s probably the best tool that we have.
Leave a Reply