While Home Depot (NYSE: HD) is generally known for its robust business and reliable dividends, the current economic environment hasn’t exactly boosted HD stock. Since the start of the year, HD is down 4.45%, with a trailing-year performance of more than 8% below parity. Despite challenges ahead of its quarterly financial disclosure, the home improvement retailer just flashed a quant signal in the charts that could appeal to aggressive speculators.
Table of Contents
First, we have to get the not-so-pleasant news out of the way. On May 19, Home Depot will release its first-quarter earnings report, with analysts anticipating earnings per share of $3.41 on revenue of $41.54 billion. Based on the year-ago print of EPS of $3.56 and revenue of $39.86 billion, the figures should be reasonable. However, the previous three disclosures have been mixed, leading to some skepticism for HD stock.
Not only that, the fundamentals aren’t exactly pointing in a favorable direction. In recent years, the annual sales growth rate has been sluggish, which could potentially disappoint the stakeholders of HD stock. Further, flat same-store sales suggest that overall demand is stagnating. That’s going to raise questions about valuation. While HD’s multiple has been fading, investors may still view the name as overpriced.
Finally, sophisticated market participants might consider the options market a signal of concern about Home Depot stock. By looking at where call and put options are positioned, the smart money does appear to be biased toward downside protection.
That’s a clear warning sign — there’s no getting around that. But there’s also another way to interpret the tealeaves.
Volatility Skew Shows Risk for HD Stock But Also Opportunity
One major indicator that suggests that all may not be well with HD stock is the underlying volatility skew, particularly for the June 18 expiration date. A useful gauge of structural sentiment, volatility skew measures implied volatility (IV) — or a measure of anticipated forward movement — across the strike price spectrum of a given options chain.
We don’t really need to get into the granularity of the skew as it likely only muddies the water. Instead, the most important aspect to grasp is the concept. Essentially, the indicator represents an insurance market, with traders buying either downside or upside protection.
Regarding Home Depot stock, the skew features a volatility “smile,” with protection being sought on both ends of the spectrum. What this roughly translates to is that traders are pricing for both upside convexity and downside mitigation — they want to enhance exposure in case HD stock rips higher but are also hedging their bets if it doesn’t.
However, the smile is clearly elongated on the bullish side of the coin, which implies that traders are paying a higher-than-normal premium for far out-the-money calls. On the other hand, the skew to the bearish side is more accelerative, reaching its peak much quicker than the bullish counterpart. This dynamic suggests that the dominant concern is that HD stock may encounter rough weather.
But just like auto insurance, just because people are paying more for their coverage doesn’t necessarily mean that an accident is more likely to occur. To make that leap, we would have to work with the presupposition that the smart money is prescient relative to the public. Granted, that does seem logical but until we get some correlative evidence, this assumption is merely a guess.
Plus, there’s another aspect to the ‘risky’ volatility skew. If traders are paying relatively higher-than-normal premiums for downside protection, the equivalent move in volatility units should be cheaper on the bullish side. Basically, if you have justification to take a contrarian position, you can arbitrage the market’s fear.
I believe the justification just flashed in the technical charts.
Using an Inductive Model to Trade Home Depot Stock
While the volatility skew is a useful tool, it’s a structural snapshot of insurance demand. As such, it doesn’t really provide a probability of what may happen next. However, an inductive model — which relies on the uniformity of nature — provides an imperfect clue as to what we may expect.
Another term for pattern recognition, induction assumes that the future will resemble the past. In non-deterministic systems where the outcome cannot be absolutely, logically deduced, induction is the best tool that we have. However, it does run the black swan risk: just because you see a thousand white swans does not necessarily mean all swans are white.
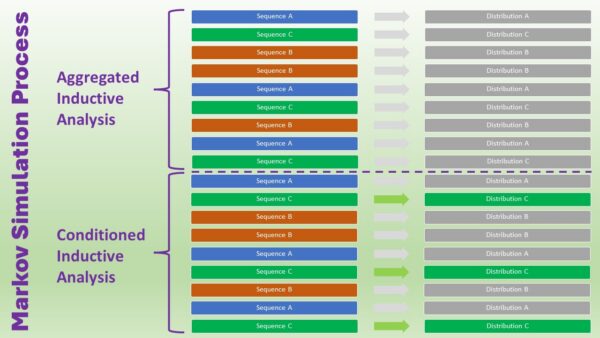
In addition to an inductive ‘if this, then that’ framework, we can apply a Markovian simulation on equity market data. Under Markov, the probability of the future state occurring depends on the condition of the current state. I define a state as a 10-week period. Thus, to find the next 10-week distribution, I look at the latest 10-week distribution.
Putting Theory to Practice
Using a dataset going back to January 2007, a random 10-week-long position in HD stock usually leads to a bullish bias. Out of 989 rolling 10-week sequences, 650 of them rose above the starting point, yielding a 65.7% exceedance ratio. That’s what you would expect from a blue-chip giant.
However, the average returns are modest. Assuming a starting price of $328.80 (Thursday’s close), the forward distribution would likely range between $320 and $350, with probability density peaking near $334. However, we’re not interested in betting on the aggregate performance of Home Depot stock.
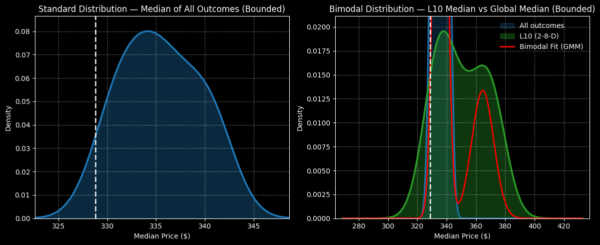
Instead, we’re looking at the conditional probability of the current signal. In the last 10 weeks, HD stock printed only two up weeks, leading to an overall downward slope. Under this extremely rare signal, the forward distribution would be expected to land between $300 and $400. So, while there’s a chance of greater downside relative to the baseline, there’s also far greater potential opportunity.
With the wide distribution, there are a lot of options (no pun intended). However, aggressive speculators may consider the 345/350 bull call spread expiring June 18. If HD stock rises through the $350 strike at expiration, the maximum profit clocks in at over 156%.
Leave a Reply