
In financial publications, one of the more annoying tactics (at least I find it annoying) is the axiomatic pivot — and there are few companies like Tesla (NASDAQ: TSLA) that attract this type of reasoning. A commonly recurring theme recently is that TSLA stock should not be priced as a vehicle company but rather as a tech innovator.
Table of Contents
An article by Finterra illustrated a sophisticated version of this thesis, stating that, “Crucially, Tesla’s model is shifting toward a ‘razor and blade’ strategy: selling hardware (cars) at lower margins to build an installed base for high-margin recurring revenue via FSD software and the burgeoning Robotaxi network.”
Cynically, this framework practically (though I’m sure unintentionally) serves as an apologist’s argument for Tesla’s mixed earnings report. While the company saw net income rise 17% from the year-ago quarter (along with a 16% lift in revenue), deliveries of only 358,023 and a subsequent rise in global vehicle inventory disappointed investors.
TSLA stock was down roughly 4% prior to the disclosure and was only modestly higher during Friday’s early pre-market trading. On a year-to-date basis, the security has fallen nearly 17%. However, because of the market apparently viewing Tesla incorrectly (through the vehicular lens as opposed to the software), this could be a discount.
At least for the near-term picture, TSLA stock could very well be underpriced. But I also think it’s not a time to get cute with narratives: Tesla is very much a vehicle company and should be traded as such.
There’s no doubt that the electric vehicle manufacturer is very much a tech innovator — and that service revenue is certainly a juicy catalyst for the company. However, Tesla is not an underpriced software company that just happens to be dragging around a massive, overpriced anchor of car factories.
In other words, as wonderful as the underlying software business is, it’s the parasite to the EV body — and parasites cannot outgrow their hosts. So yes, investors do have every right to be concerned about sagging deliveries. If this figure continues to erode, the software revenue will eventually hit a physical limit.
Still, that doesn’t mean there aren’t opportunities in TSLA stock; you just have to be more selective.
An Inductive Approach to Forecasting TSLA Stock
One of the common facts that hasn’t been cited much in the financial publication space is the current behavioral state of TSLA. In the past 10 weeks, the security printed only three up weeks, leading to an overall downward slope. Since January 2019, this 3-7-D sequence has only materialized 34 times on a rolling basis.
To most traders, that’s just an unremarkable technical fact. However, identifying this unique signal helps us to formulate an options strategy for Tesla stock.
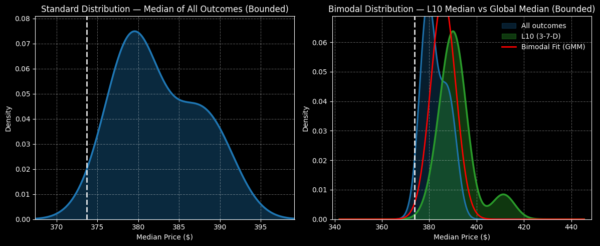
In any given 10-week period going back to 2019, a random long position is likely to generate a positive return. Specifically, out of 362 rolling 10-week periods, 200 of them have breached the starting point. That gives us an exceedance ratio of 55.2%. Put differently, if we bought TSLA stock across a hundred parallel universes at the same time, we would expect to come out ahead 55 times.
Further, the distribution of outcomes is quite sizable. If we assume a starting price of $373.72 (Thursday’s close), Tesla stock would likely range between $368 and $400, with probability density peaking at around $379.
What’s the point of mentioning all this? What we’re doing here is conducting discretized inductive analysis. Induction is really just a fancy term for pattern recognition, relying heavily on the uniformity of nature: that the future will resemble the past.
In this case, since we have witnessed TSLA stock demonstrate a bullish bias over a random 10-week period, we are anticipating that the next 10-week period will likely (though not certainly) lead to a positive return. However, what if we were to condition this data and focus on the distribution of a specific signal?
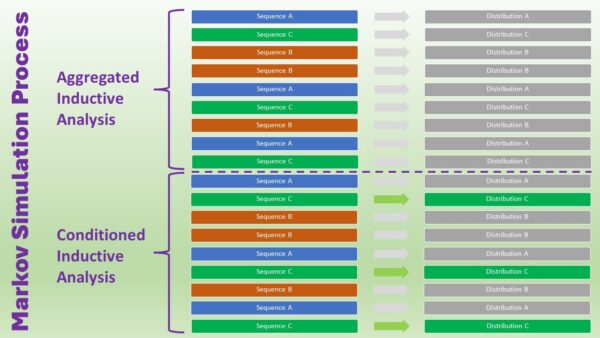
As I stated earlier, Tesla stock is quantitatively flashing a 3-7-D sequence (on a discretized weekly basis). Therefore, we would be looking to see how TSLA historically reacts to this signal — not to an aggregation of all possible 10-week sequences. While any form of inductive analysis is vulnerable to the black swan risk, this Markovian methodology (where forward probabilities largely hinge on the current state) is much more defensible.
Under 3-7-D conditions, the exceedance ratio of TSLA stock is about the same as under aggregate conditions: 55.9% versus 55.2%. However, the theoretical forward 10-week distribution shifts to between $370 and $422, with probability density peaking at $390.
With this calculation, the underlying options trading idea really speaks for itself.
Identifying a Tempting Trade
At this point, the heavy lifting is done. If you assume that the above inductive analysis will have some decent probability of holding true over the next several weeks, there’s arguably one trade that stands above the rest: 385/390 bull call spread expiring June 18.
For this trade to be fully profitable, Tesla stock must rise through the $390 strike at expiration. If it does, the maximum payout clocks in at roughly 133%. Further, the net debit per spread is reasonable at $215, translating to a profit of $285 (assuming the second-leg strike is triggered at expiration).
Some options professionals may avoid the 385/390 bull spread because of how thin the wings are. With a breakeven price of $387.15, TSLA stock really has to hit the $390 target for this trade to work. Admittedly, there’s little margin for error. But because of this small margin, the net debit is relatively cheap.
Plus, this is also where the inductive approach gives retail traders a massive advantage. By running a Markov simulation of TSLA’s current quant signal, we now have an understanding of how the security is likely to respond.
Of course, there are zero guarantees with any forecasting tactic. However, with the data pointing to a coalescing around the $390 strike, speculators may be incentivized to consider a trade here.
Leave a Reply