
With International Business Machines (NYSE: IBM) set to release its first-quarter earnings report on Wednesday after market close, plenty of eyeballs will be on the legacy tech giant. Should “Big Blue” deliver the goods, IBM stock could be well on its way toward a recovery.
Table of Contents
Let’s look at the raw stats first. Wall Street analysts will be looking for earnings per share to hit $1.81 on revenue of $15.64 billion. In the year-ago quarter, the company posted EPS of $1.60 on revenue of $14.54 billion. Initially, the news wasn’t well-received, leading to a sharp drop in market value. However, investors eventually digested the potential long-term implications, leading to a remarkable rally in IBM stock.
It’s possible that a similar outcome may materialize this year following the Q1 disclosure. While IBM stock has long suffered a reputation for being a boring heritage play, the underlying business has really started to shine with relevant innovations. Perhaps most impressively, IBM’s WatsonX AI platform has moved beyond the pilot phase and is witnessing massive enterprise adoption. Notably, the company’s generative AI “book of business” now exceeds $12.5 billion.
Another innovation to keep watch on is the tech juggernaut’s “Nighthawk” quantum processor, which has achieved verified quantum advantage certification for specific financial modeling tasks. During the nascent period of quantum computing, the tech largely operated as a lab queen. Now, Big Blue is demonstrating a viable road for potential commercialization. If this monetization pursuit is successful — or demonstrates continued momentum — IBM stock could see a positive valuation rerating.
If being honest, the most appealing factor for the security from an options perspective is its recent underperformance. Since the start of the year, IBM stock is down more than 14%, which is sizable considering its boring, blue-chip status. If a bounce-back were to occur, the leverage provided by multi-leg options strategies can make for a lucrative trade.
Of course, the question hangs in the air: is there justification to be bullish on IBM stock? Inductive analysis suggests that there might be.
A Quick Introduction to Induction
While the term induction may sound upper-tier, it’s really just another name for pattern recognition. What we’re saying is this: given a specific signal materializing, what is most likely to happen in the future? If you think about it, all forecasts about the unknown future are inductive.
For example, a common pattern in technical analysis is the head-and-shoulders pattern. According to the discipline, if you see this pattern, there’s a good chance that the stock in question will fall in value. However, one of the common criticisms of the technical approach is that it’s awfully subjective. What exactly is a head and shoulders? And what does “good chance” mean mathematically?
To narrow down the subjectivity involved in such forecasting methodologies, I prefer a discretized inductive analysis. This means we translate the scalar signal of price into discrete signals. Next, we isolate the specific signal we are looking for and correlate the data into forward distributions.
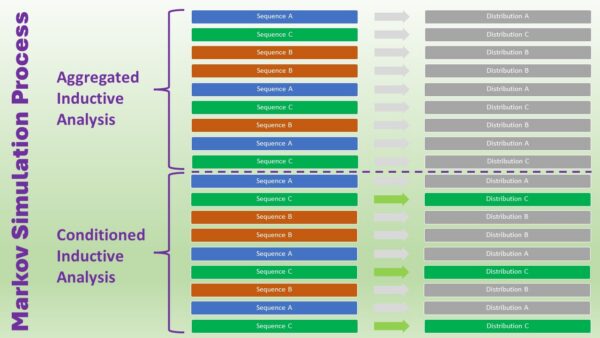
My model looks at the last 10 weeks to find out what can happen in the next 10 weeks. First, we take an aggregate of all unique 10-week signals and calculate the results 10 weeks later. Next, we isolate the sequence for the last 10 weeks (whatever that sequence may be) and filter the correlation for that particular signal.
In this manner, we can understand if there’s any statistical advantage in acting upon the current signal over trading the target stock randomly.
Shifting Over into the Practical Realm for IBM Stock
Let’s now take the inductive approach and apply it to IBM stock. Using a dataset going back to January 2019, we can calculate that a 10-week long position will typically generate an average forward distribution ranging between $252 and $259 (assuming a starting price of $253.47, Friday’s close).
Nominally, we’re looking at 361 rolling 10-week sequences, 202 of them rising above the aforementioned spot price. This translates into an exceedance ratio of 56% — a solid (and expected) advantage for the buy-and-hold types. However, this distribution is based on the aggregate of all sequences, which includes signal and noise.
What we want to do is to strip the noise and focus strictly on the signal. And that signal is this: in the past 10 weeks, IBM stock printed only three up weeks, leading to an overall downward slope. Under this 3-7-D signal, IBM’s forward distribution has a tendency of shifting bullishly, with average outcomes over the next 10 weeks ranging between $245 and $275.
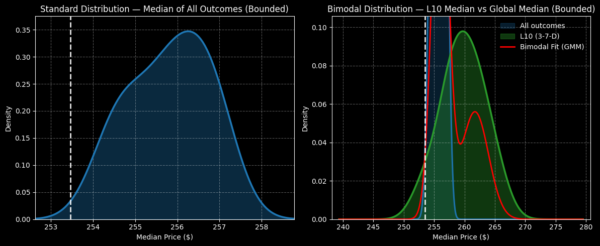
Moreover, under 3-7-D conditions, the exceedance ratio pops to 73.7%. As well, peak probability density lands at $260 (as opposed to $256.20 under aggregate conditions). Based on this inductively calculated data, there certainly appears to be a rational reason to bet on IBM stock right now.
Of course, a serious word of caution is warranted. First, the 3-7-D signal has only materialized 19 times since January 2019, which is admittedly a small sample size. Unfortunately, that’s the consequence we must absorb when we filter a specific signal from the noise.
Second, induction is far from perfect. Just because you see a thousand white swans doesn’t mean all swans are white. In other words, there’s always a chance that an inductive analysis can go awry. We’re talking about probabilities here, not certainties.
Looking at a Specific Options Idea
Nevertheless, induction arguably remains the most powerful tool that retail options traders have at evening the playing field. If you want to take a speculative bet, I find myself interested in the 260/275 bull call spread expiring June 18. This trade requires speculators to buy the $260 call and sell the $275 call simultaneously on a single ticket.
Should IBM stock rise through the $275 strike at expiration, the maximum payout would clock in at nearly 107%. Also, the current breakeven price on this spread sits at $267.25, which helps improve the trade’s probabilistic credibility.
Granted, this bull spread is an ambitious one because $275 sits at the edge of our signal’s forward distribution. But given the underperformance on a YTD basis, the potential comeback could be larger than average.
Leave a Reply