
Pharmaceutical giant Eli Lilly (NYSE: LLY) will report its fiscal first-quarter earnings on April 30. It appears to be arriving at an inopportune time. Since the start of the year, LLY stock is down almost 18%, some of that being a reflection of current broader anxieties. At the same time, Eli Lilly’s much-anticipated Foundayo drug — a once-daily oral GLP-1 receptor agonist for weight loss and management in adults — appears to be struggling relative to competing oral weight-loss drugs.
Table of Contents
With the market straining for decisively optimistic data, the news that second-week scripts for Foundayo generated only modest results led to a recent sharp decline in LLY stock. Fundamentally, the core distraction is that Wegovy — manufactured by Novo Nordisk (NYSE: NVO) — saw far more prescriptions in its second week than Eli Lilly’s new oral therapeutic.
That’s problematic from a patient experience standpoint because of a rising debate in efficacy between the two weight-loss drugs. According to a report cited by BioSpace, Wegovy (under the 25mg dosage) showed 3.2% greater weight loss than Foundayo. Thus, the implication is that, despite the arrival of the new competitor, patients will likely prefer the former drug.
However, the nuance here centers on logistics, of which Wegovy is a nightmare. Patients must take it on an empty stomach with exactly four ounces of water and wait 30 minutes before eating. On the other hand, Foundayo can be taken any time of day, with or without food. Eli Lilly believes this attribute offers a real-world advantage that will lead to superior long-term adherence.
From this angle, it’s quite possible that LLY stock could be undervalued — or is at least overly penalized by the “fear discount.” According to medical literature, when a therapeutic’s regimen becomes increasingly complicated, adherence becomes problematic. What the bulls are arguing for Eli Lilly, then, is that while Novo Nordisk may offer the slightly more effective drug, Eli Lilly brings to the table superior accessibility.
Another component that adds fuel to the fire is the upcoming Q1 earnings report, scheduled for April 30 (before the opening bell). If management can reveal data that supports its assertion that the long-term trajectory of Foundayo is more encouraging than recent reports have suggested, that could provide a strong catalyst for LLY stock.
An Inductive Approach to Analyzing LLY Stock
While the nuances behind Foundayo provide an intriguing narrative, it’s also difficult to fully understand how much of this dynamic has been reflected in Eli Lilly stock — if at all. There’s an assumption that if the pharma giant beats its headline numbers (earnings per share of $6.97 on revenue of $17.83 billion), LLY could be off to the races. However, that proposition likely depends on how much of the news has been baked into the share price.
Frankly, that methodology gets into a subjective game that’s difficult to assess quantitatively. That’s why I prefer a discretized inductive analysis to condition forward probabilities based on objective data.
Now, induction is really just a fancy term for pattern recognition. This philosophy relies heavily on the uniformity of nature, that whatever happened in the past is likely to repeat in the future. It’s another way of assigning correlations: should X happen, Y is likely to happen. Certain disciplines within technical analysis operate the same way. For example, if you see a head-and-shoulders pattern, that apparently signals a higher likelihood of a descending share price.
Unfortunately, the inputs of technical analysis are often extremely subjective, which is why I believe discretization is critical. By looking at discrete signals (such as the frequency of positive and negative weekly candlesticks), the data inputs of the underlying methodology are objective and consistent.
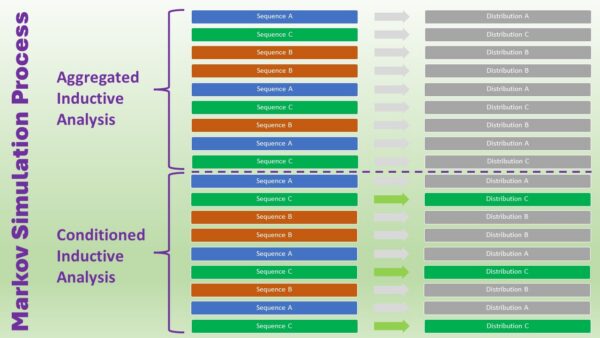
Personally, I run Markov simulations on potentially viable securities like LLY stock, which weigh forward probabilities based on the current behavioral state of the system. I define a state as a discretized 10-week period of price action. From there, I inductively calculate the probability of the next behavioral state materializing based on the current state.
In other words, I attempt to answer this question: given the last 10 weeks of price action, what is the likely forward distribution of the next 10 weeks? It’s the search for this answer where things get interesting for speculators.
Comparing Expectations Versus the Baseline for Eli Lilly Stock
On any given 10-week period, a trader holding LLY stock is likely to enjoy a noticeably strong upward bias. Out of 362 rolling 10-week sequences going back to January 2019, 233 of them popped higher than the starting price. This gives us an exceedance ratio of 64.4%. Further, the distribution of average outcomes would typically land LLY between $870 and $950, with probability density peaking at around $905.
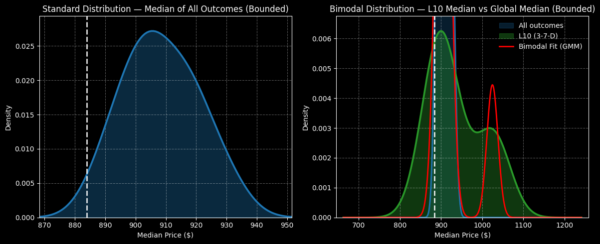
However, we’re not interested in analyzing LLY stock as an aggregate of all possible 10-week sequences. Instead, we’re focused on the current signal. In the past 10 weeks, LLY printed only three up weeks, leading to an overall downward slope. Under this 3-7-D signal, the exceedance ratio jumps to 80%. Further, the forward distribution lands between $780 and $1,130.
Before you jump on the bullish bandwagon for Eli Lilly stock, a serious word of caution: we’re talking about a very small sample size of the aforementioned signal. Also, the forward distribution — based on a mixture of Bayesian-lite inference and conditioned historical data — does show expanded risk exposure (along with the enhanced reward profile).
Basically, LLY stock has become a high-risk, high-reward play — but the data (though diminutive in sample size) leans bullishly.
If you’re a diehard contrarian but rationally approach your trade through a quantitative lens, the idea to look into may be the 990/1000 bull call spread expiring June 18. This narrow spread requires LLY stock to rise through the $1,000 strike at expiration to be fully profitable. If it does, the maximum payout clocks in at 150%.
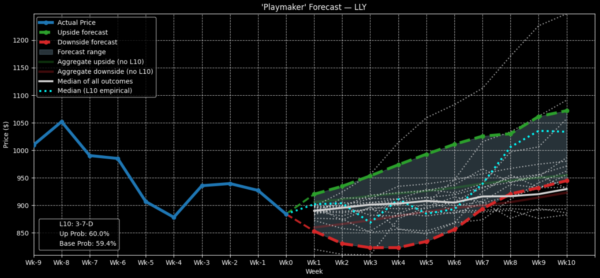
From a week-to-week Markov simulation, LLY historically has a tendency to rise in the latter weeks under 3-7-D conditions, making the $1,000 target potentially feasible. But it’s also fair to point out that a lot is riding on Eli Lilly’s earnings and how it frames Foundayo prescriptions. Ultimately, it’s a trade to consider if you don’t mind throwing caution to the wind.
Leave a Reply