
For those seeking an ambitiously bullish idea in the computer chip manufacturing industry, Taiwan Semiconductor (NYSE:TSM) may offer a compelling opportunity. Most commonly known as TSMC, the chip foundry plays an integral role in artificial intelligence and other advanced innovations. As its public profile states, the entity is best known as ranking among the world’s most valuable semiconductor companies. Because of this relevance, TSM stock has gained over 53% year-to-date.
Table of Contents
However, like other tech-centered enterprises, TSM stock did suffer a downturn in the middle of the fourth (calendar) quarter. Basically, many investors began worrying about the escalating hype train in generative AI. While no one doubts the transformative potential of the innovation, anxieties began to zero in on the financial prudence and sustainability of rising capital expenditures.
To make a long story short, the main concern was that machine learning’s low-hanging fruit has been plucked. With the competitive environment becoming more crystallized, investors began pivoting more toward a “show me” stance. Because of this heightened scrutiny, even tech stalwarts like Oracle (NYSE:ORCL) suffered severe value deflation.
Amid the carnage, the one positive for TSMC was that the overall downturn wasn’t all that terrible. From Halloween to the close of the Nov. 21 session, TSM stock only lost 8.44%. Even better, thanks to some bullish — albeit choppy trading — the security is back above the $300 mark.
Two factors are in play here. First, while the tech sector has suffered, many top names — such as Nvidia (NASDAQ: NVDA) — are staging a comeback, indicating that positive sentiment could be returning to the innovation space. Second, TSM stock just flashed a rare quantitative signal that just might be broadcasting a push toward all-time highs.
Tossing Aside Old Assumptions About TSM Stock
To be honest, the idea that TSM stock might soar to new heights would be considered a risky proposition. Fundamental analysts would look at TSMC and note the rich premiums:
- Against trailing year earnings, TSM stock is priced at a multiple of 31.49.
- Against forward earnings, the stock is priced at a multiple of 25.19.
- TSMC’s price-earnings-to-growth (PEG) ratio stands at 1.48 times.
- Finally, TSM is trading at almost 14 times last year’s sales.
As any prominent financial resource will tell you, these states are elevated relative to where they were a year ago; heck, some of the stats are elevated relative to where they were mere months ago. Most experts will look at TSM stock and state that the business is “priced for perfection.”
Rhetorically, this statement simply means that a lot of enthusiasm is already priced into the security. Because of this circumstance, TSMC will really need to deliver the goods for its next earnings disclosure, which is scheduled for mid-January. Anything less and investors could rush for the exits.
It must be said, though, that this is a colloquial embellishment that has no real fundamental meaning. After all, every stock is technically priced for perfection. To say otherwise would be to assume that Wall Street knowingly leaves money on the table, which is ridiculous.
In fairness, concepts such as “priced for perfection” can be stated in the open market because the arena is relatively forgiving. Unfortunately, the options market is brutally unforgiving because of the expiration dates, as well as the extreme volatility of the contract prices. To survive and thrive here requires a scientific methodology — and even then, options are pure chaos.
Finding a Method in the Madness
Still, options continue to entice speculators of all stripes because of their tremendous leverage. Because each option contract synthetically represents 100 shares of the underlying security, small movements in the open market can translate to massive rewards in the derivatives market. What’s more, with advanced analytics, it’s possible to gain an edge — even against Wall Street pros.
Primarily, our best bet is to uncover structural arbitrage or the outcome variance between what the market believes is probable versus what is likely to materialize. To find this type of arbitrage, though, requires us to discretize price action in a bid to uncover market patterns and behaviors.
Let’s imagine that you took a single 10-week strand of TSM stock price data. Obviously, the return during this period won’t tell you anything about the probability of performance for the other weeks in the dataset. However, if we took hundreds of rolling 10-week trials and stacked them onto a fixed-time distribution, the most frequent, consistent pricing behaviors would lead to bulges in probability mass.
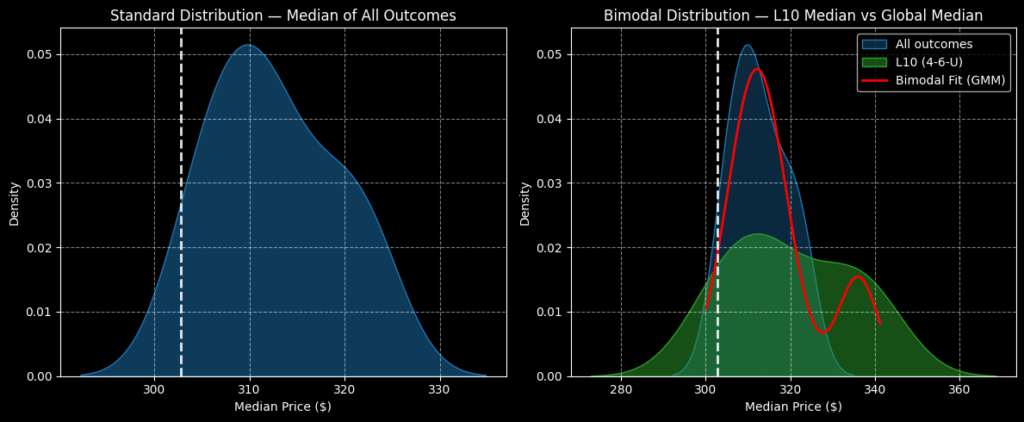
These bulges represent risk geometry, which is the shape of the risk-reward sentiment interplay. Risk geometry reveals to us the ascendancy of bullish sentiment among buyers. More importantly, it shows us the transition point where buyers are tempted to become sellers. In this manner, we gain great insight as to where we can push — and where we should back off.
In the case of TSM stock, its forward 10-week returns would typically range between $292 and $338 (assuming an anchor price of $302.84, Friday’s close). Further, price clustering would likely be predominant at $310.
However, we’re interested in the statistical response to the current quantitative signal, which is the 4-6-U sequence. In the past 10 weeks, TSM stock printed only four up weeks, yet the overall slope was upward. Under this contrarian signal, TSMC’s forward 10-week returns may range between $276 and $364, with primary price clustering likely to be predominant at around $312.
Interestingly, though, secondary clustering may sprout at $340, which sets in motion a prospective bullish trade.
Using Risk Topography for a High-Conviction Wager
With the help of advanced algorithms, it’s possible to calculate risk topography, which is a three-dimensional representation of probability space. With this innovative tool, we can assess the depth of relative probability, along with the location of where forecasted activity is likely to coalesce.
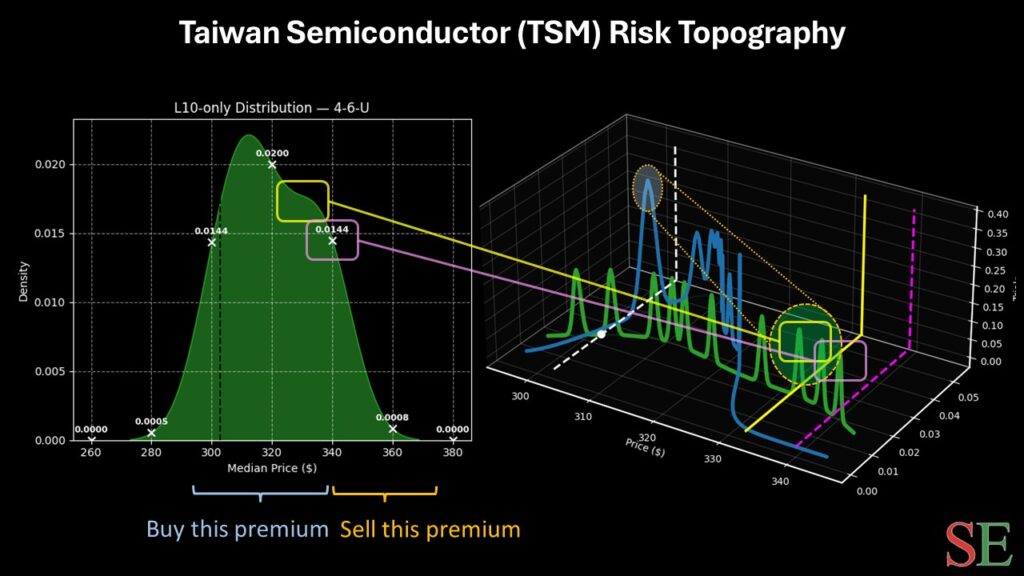
It shouldn’t come as a surprise that most activity is projected to occur at a lower price point, between $310 and $320. Therefore, bullish traders who want to be as conservative as possible may consider this zone for their options strategies.
Nevertheless, risk topography also reveals that there is a solid chance of elevated activity between the $330 and $340 price levels. Therefore, the most aggressive traders may consider the 330/340 bull call spread expiring Feb. 20, 2026.
For this trade to be fully profitable, TSM stock would need to rise through the $340 strike price at expiration. Doing so would generate a maximum payout of over 277%. With a breakeven price of $332.65, this is a bold but surprisingly rational wager.
Leave a Reply