
Amid renewed hostilities in the Middle East, Occidental Petroleum (NYSE: OXY) suddenly makes for an intriguing proposition. Obviously, with the Strait of Hormuz back in the geopolitical spotlight, concerns have reemerged about potential supply constraints. Naturally, the implied rise in inflationary pressures should cynically benefit OXY stock, making it a must-watch name.
Table of Contents
Coincidentally, my good friend Will Ashworth of Barchart recently discussed brewing optimistic options activity that suggests good tidings for bullish derivatives strategies, which he laid out in his article. To be consistent with my recent equities market framework, I’m not too big on the idea of citing unusual, big-block orders.
First, you’re never sure what the motivation is behind these trades, nor can you tell if they are a standalone play or integrated into a multi-leg strategy. On a structural level, once a retail trader sees the order in the options flow screener, the market maker has already adjusted their books to stay delta-neutral. Thus, if you buy the unusual options in OXY stock, you’re securing the derivatives at a peak premium to implied volatility (IV).
Still, as a general philosophy, Ashworth’s citation of unusual options activity and the proposed bullish trades makes sense. Thanks to the sudden geopolitical catalyst, it’s only natural that the smart money is actively responding to the development. However, we should also be honest that the options market is a zero-sum game. That means if someone is bullish on OXY stock, the counterparty is bearish.
So, is unusual options activity a useless signal? I wouldn’t go that far but it’s just information that happened in the past. A much more useful indicator is the volatility skew. If you look at the skew for the near-term Aug. 7 expiration date, you’ll notice that the IV for out-the-money (OTM) puts and OTM calls are more elevated than their at-the-money (ATM) equivalents.
In other words, the smart money is both bullish and bearish on OXY stock: these traders are positioned for potential upside but are also protecting themselves against a possible implosion.
Deciphering the Uncertainty Behind OXY Stock
It’s worth pointing out that for large public enterprises, the risk profile is structurally skewed to the downside (known colloquially as a smirk). That’s because eventually, all successful enterprises hit the law of large numbers. Basically, this principle states that improving growth metrics will be significantly more difficult due to diminishing marginal returns. However, a big company can easily lose substantial value in one fell swoop.
As we know from first-hand experience, it may take years to build something but a single black-swan event to implode value. That’s why OTM put IV is often skewed higher for these firms. There’s less potential for robust growth (hence the relative lack of call options) but a high potential for a catastrophic loss.
With this in mind, it’s crystal-clear why the volatility skew for OXY stock is a smile rather than a smirk. A sustained conflict in Iran would likely lead to a spike in oil prices, which would benefit Occidental Petroleum. However, the Trump administration backing off — which would not be unheard of — may create the opposite effect.
In a way, I find the citation of the options market for Occidental stock among the financial publication crowd to be funny: it’s admitting that Wall Street doesn’t know how this situation will pan out. So, calling Occidental bullish using options data is a category error. If the skew is a smile (meaning protection against both upside and downside risk), calling unusual options activity as predominantly bullish is looking at only one side of the coin.
Okay, so this all raises an important question: why did I say I was bullish on OXY stock? It comes down to a combination of inductive inference and the balance of order flow.
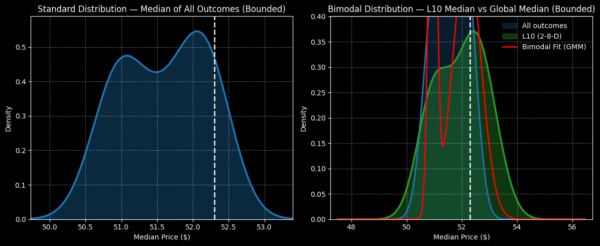
Currently, the balance of order flow is decisively negative. In the past 10 weeks, OXY stock has printed only two up weeks, leading to an overall downward slope. This 2-8-D sequence is rare, having only materialized 16 times since January 2019. As such, there are serious statistical validity concerns here.
Nevertheless, if you extend me some rope, when data is conditioned for this 2-8-D sequence, we may expect OXY stock to generate a forward 10-week median distribution landing between $49 and $55 (assuming a starting price of $52.30), with probability density peaking at around $52.50.
While this performance doesn’t sound like much, if we bought OXY stock randomly, the expected 10-week forward distribution would be between $49.50 and $53.50, with probability density around $52 on average. Thus, by playing the aforementioned signal, there’s an average positive variance of about 1%.
Explaining the Theory Behind the Induction
Now, why would OXY stock bounce higher off the 2-8-D signal when the random benchmark features a neutral to slightly bearish bias? We know that in the modern equities market, much of the trading is dominated by algorithmic or rules-based protocols. Therefore, with OXY stock taking a quantitative beating over the past 10 weeks, its forward 10 weeks will likely be influenced by algorithms viewing Occidental stock as a discount.
Further, it’s also important to note that the expected forward distribution will likely not be linear. Instead, an inductive analysis reveals that, if past patterns were to apply moving forward, OXY stock is likely to rise through week 4 before encountering a corrective lull.
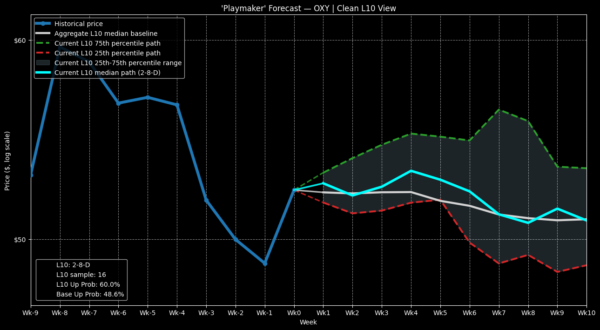
Based on prior patterns and the possibility of a positive catalyst following Occidental’s second-quarter earnings report — scheduled for release on Aug. 5 — aggressive speculators may consider the 54/55 bull call spread expiring Aug. 7. With the two factors combining, a $55 target within the time specified wouldn’t be out of the question.
Also, I like the nominal risk-reward profile: you’d be putting down $49 per spread for the chance to make a maximum payout of 104%. Further, you’d be aligned with the implications of the volatility skew, which covers both bullish and bearish risk. In other words, we’re bullish for the time period justified by past patterns but we’re also cutting off exposure to the period where OXY stock has historically underperformed.
I want to caution that an inductive model is never foolproof because you can’t guarantee the uniformity of nature. However, in the absence of a better explanatory framework, induction is one of the best tools that retail traders have.
Leave a Reply