
Tempus AI (NASDAQ: TEM) ranks among the most intriguing use cases of artificial intelligence, with the health technology company focused on using data and machine learning to create precision medicine services. These include diagnostics for oncology, cardiology, radiology and mental health. Although TEM stock appears promising, it’s been quite a choppy and volatile ride. Also, it has a limited history as a public company.
Table of Contents
This context makes Tempus AI’s upcoming fourth-quarter earnings report all the more critical. Wall Street analysts are anticipating a loss per share of 14 cents on revenue of $364.75 million. In the year-ago quarter, the health tech specialist posted a loss of 18 cents per share on revenue of $200.68 million. Both these stats missed expectations, which contributed to a steep fall in TEM stock.
To be sure, smart money traders appear uncertain about how the chips may fall when Tempus AI releases its results on Tuesday after the market close. Unfortunately, there doesn’t appear to be that much of a correlation between the financial print and the subsequent price action of TEM stock. As such, there’s hedging activity on opposite tails of the security’s expected forward distribution for the Feb. 27 expiration date.
Still, circumstances appear to be relatively calm in future expiration dates, potentially signaling an opportunity for extreme speculators.
Volatility Skew Offers Key Intel for TEM Stock
One of the most important indicators for retail traders to consider is volatility skew. Definitionally, the skew identifies implied volatility (IV) — or a stock’s potential kinetic output — across the strike price spectrum of a given options chain. Colloquially, the skew shows the surface area distortion of volatility space, thereby signaling where smart money traders perceive the greatest risk to exist.
In an options chain that features no bias, the skew would be perfectly flat. However, for a popular and heavily traded security like TEM stock, there’s always going to be transactional bias. For the upcoming Feb. 27 expiration date, the skew is relatively flat and calm for strikes near the spot price. However, as I explained above, on the edges, the skew noticeably tends to be spiky.
This setup suggests that, especially for the nominally lower strikes, there is some urgency among smart money traders to protect against downside risk. That’s to be expected given the choppiness and unpredictability of TEM stock. Also, recent news of insiders selling shares doesn’t exactly inspire confidence.
Despite this splotchy picture, the future options chain for TEM stock appears rather calm. For example, the skew for the March 20 expiration date almost seems unusually flat, with the curvature only rising in a controlled manner at the edges. Here, we’re talking about downside mitigation but without an overt sense of urgency.
That’s really odd for a security that’s down 23% over the past six months.
Establishing the Trading Parameters of Tempus AI Stock
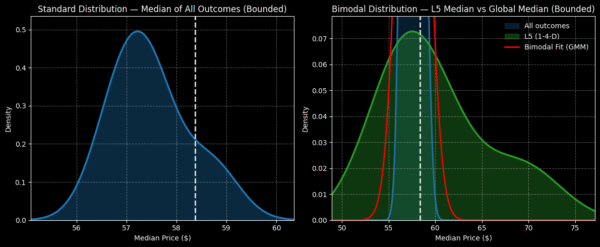
While we now have a working framework of the smart money’s transactional bias, we still need to know how this translates into actual price outcomes. For that, we may turn to the Black-Scholes-derived expected move calculator. Wall Street’s standard mechanism for pricing options anticipates that for the March 20 expiration date, Tempus AI stock may land between $50.07 and $67.19.
Where does this dispersion come from? Black-Scholes assumes a world where stock market returns are lognormally distributed. Under this framework, the above range represents where TEM stock may symmetrically land one standard deviation away from spot (while accounting for volatility and days to expiration).
Mathematically, the model claims that in 68% of cases, we would expect Tempus AI stock to trade somewhere within the prescribed range when March 20 rolls around. That’s a reasonable assumption, as it would really take an extraordinary catalyst to drive a security beyond one standard deviation from spot.
Still, the challenge that we’re now faced with is that we understand only how the market is pricing uncertainty; we don’t know if that pricing is actually justified. To better determine justification, we need to turn to a second-order analysis for further insights.
I’m a huge fan of the search-and-rescue (SAR) analogy, as it does much heavy lifting conceptually. If TEM stock were a lone shipwrecked survivor, then Black-Scholes would represent a satellite system that picked up a distress signal somewhere in the Pacific Ocean. Using theoretical drift patterns, it’s possible to draft a realistic search radius emanating from the signal.
Unfortunately, we live in a world of limited resources, meaning that we can’t cover every square inch of the radius. To maximize our resources, we need to use probabilistic math.
That’s where the Markov property comes into frame.
Narrowing the Probability Space
Under Markov, the future state of a system depends entirely on the present state. Colloquially, forward probabilities should not be calculated independently but should be assessed in context. Using the SAR analogy above, different ocean currents — such as choppy waves versus calm waters — will likely influence where a shipwrecked survivor may drift.
This is how the Markov property relates to Tempus AI stock. In the past five weeks, TEM printed only one up week, leading to an overall downward slope. There’s nothing special about this 4-1-D sequence, per se. However, this quantitative signal represents a unique ocean current, and survivors caught in these waters would be expected to drift in a distinct manner.
From here, we can use enumerative deduction and Bayesian-inspired inference to help estimate forward drift patterns based on past analogs of the aforementioned quant signal. To be fully transparent, you should realize that philosophically, the future is not necessarily compelled by the past. However, I would argue that induction is operationally unavoidable, unless we were to use theoretical models that are completely divorced from empirical history (which would then lead to other philosophical criticisms).
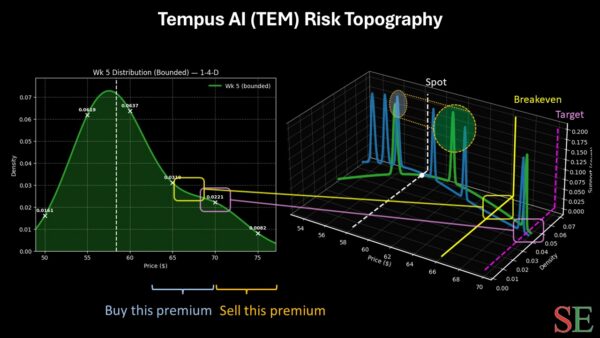
If you accept the premise above, the trade that I would find tempting is the 65/70 bull call spread expiring March 20. This trade requires TEM stock to rise through the $70 strike at expiration, which is an ultra-aggressive target. However, past analogs suggest that there is an empirical case for this price point. If TEM rises accordingly, the maximum profit would be $366, a payout of over 273%.
Breakeven lands at $66.34, helping to improve the trade’s probabilistic credibility.
Leave a Reply