
Dutch Bros (NYSE:BROS) may be a fast-rising competitor to Starbucks (NASDAQ:SBUX) but the drive-through coffee chain desperately needs a strong result for the upcoming fourth quarter. If smart money sentiments in the options market have anything to say about it, BROS stock could be an intriguing contrarian prospect. Despite losing 10% to start the new year, sophisticated market participants are prioritizing upside convexity — and that’s likely a significant tell.
Table of Contents
Let’s go over the core facts quickly. For the upcoming Q4 print — scheduled for release on Feb.12 after the close — Wall Street analysts expect Dutch Bros to post 9 cents per share on revenue of $425.62 million. In the year-ago quarter, the coffee chain posted EPS of 7 cents on revenue of $342.79 million, exceeding the consensus targets of 2 cents and $318.78 million, respectively.
Overall, the performance of Dutch Bros has been impressive. Between Q3 2023 through Q3 2025, the company enjoyed a string of nine consecutive top-and-bottom-line earnings beats. Going back to Q3 2021, it has only failed to exceed growth targets twice. That said, BROS stock is down more than 17% in the past 52 weeks, raising the stakes for the upcoming disclosure.
From a heuristic level, it is possible that BROS may be printing a pattern in technical analysis known as a bullish pennant. Between November 2024 and the present time, it can be argued that price action is being funneled into a focal point. At the apex of the pattern — where Q4 earnings could potentially light the fuse — the security could swing higher.
Frankly, I don’t want to rest my analysis on technical interpretations, especially since there is no arbiter to officially determine what a “real” bullish pennant is. The old joke that two technical analysts can look at the same chart and come up with ten different interpretations isn’t really a joke. That said, there are other sources of information that substantively drive home the case for BROS stock.
Volatility Skew Offers a Revealing Take About BROS Stock
One of the most important first-order analytical tools freely available to retail traders is volatility skew. This screener identifies implied volatility (IV) — or a security’s potential kinetic output — across the strike price spectrum of a given options chain. In the case of BROS stock for the Feb. 13 expiration date (one day after earnings), smart money traders appear to be prioritizing potential profit extraction to the upside.
We can surmise this net behavior based on call IV being generally priced higher across multiple strikes. Also, the sentiment bias becomes rather obvious on the lower strike boundaries, where call IV tends to rise well above the put equivalent. This setup communicates that sophisticated or professional investors are prioritizing long exposure through synthetic leverage.
On the upper strike boundaries, we see at the tail end that call IV modestly rises above put IV. In both cases, the rise in curvature is relatively flat. At the same time, call IV represents the dominant priority. Overall, the message here is that traders don’t anticipate significant outsized upswings. Concurrently, there is no real overriding fear about protecting against downturns.
One of the biggest takeaways from volatility skew is the relative calm in the curvature for prices near the at-the-money strike. Here, we may have a case of information by omission. Let’s remind ourselves that BROS stock is off to a rough start to the new year. As such, the natural tendency — especially for institutional investors managing big portfolios — would be to prioritize downside insurance.
Instead, the skew is telling us that from the smart money’s point of view, the risk of not calling the upside correctly is perceived to be greater than the magnitude of risk associated with not protecting against downside. That makes sense when you think about it.
Because of the recent poor performance of BROS stock, the public money may be skeptical. However, the smart money apparently sees opportunity. While it’s no guarantee that anyone is interpreting the IV premiums correctly, the volatility skew does seem to show options traders’ hands.
Establishing the Trading Parameters of Dutch Bros Stock
While we now have a general understanding of smart money sentiment from the volatility skew, we’re still at a loss as to how this translates into actual price outcomes. For that, we may turn to the Black-Scholes-derived expected move calculator. Wall Street’s standard mechanism for pricing options projects that for the Feb. 13 expiration date, Dutch Bros stock may land between $48.58 and $61.88.
Where does this dispersion come from? Black-Scholes assumes a world where stock market returns are lognormally distributed. Under this framework, the above range represents where BROS stock may symmetrically land one standard deviation away from spot (while accounting for volatility and days to expiration).
Essentially, what the model is saying is that in 68% of cases, we would expect BROS stock to trade somewhere within the prescribed range when Friday beckons. That’s a reasonable assumption, if only because it would take an extraordinary catalyst to drive a security beyond one standard deviation from spot. Still, we’re left with a rather sizable peak-to-trough range of over 27%.
We’ve basically arrived at the point of maximum utility for first-order analyses, which are essentially observational tools. Again, they’re freely available to all traders. That’s not to say that volatility skew and expected moves are not important. But by logical framing, something that is freely available and commonly known — at least among educated traders — cannot be considered an edge.
As I’ve said many times before (because the analogy does a lot of heavy lifting for me), what we have here is the classic search-and-rescue (SAR) dilemma. Black-Scholes identified a distress signal that went out somewhere over the Pacific Ocean. By the time our search team arrives at that point, the shipwrecked survivor has drifted away.
Obviously, we need to look for the survivor, but we are also constrained by limited resources (and daylight). The expected move provides a theoretical search area, but we need a second-order analysis or a conditioned observation. That’s where the Markov property comes into view.
Using Science to Narrow Down the Probability Space
Under Markov, the future state of a system depends entirely on the present state. Colloquially, forward probabilities should not be calculated independently but be assessed in context. Regarding the SAR analogy, different ocean currents — such as choppy waves versus calm waters — can easily influence where a shipwrecked survivor is likely to be found.
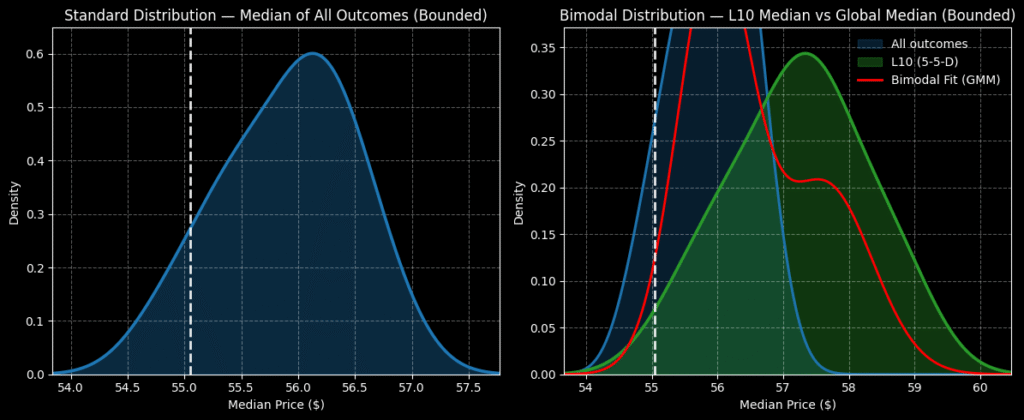
Here’s how the Markov property is relevant for Dutch Bros stock. In the past 10 weeks, BROS printed five up weeks, but with an overall downward slope. There’s nothing special about this 5-5-D sequence, per se. However, this quantitative signal represents a unique ocean current. As such, we would expect a survivor caught in these waters to drift in a particular manner that would be different compared to other currents.
From here, we use a process known as enumerative induction, where we take past analogs of other 5-5-D sequences and apply the median observed performance rate to the current spot price. In addition, we would layer in data from Bayesian-inspired inference to better estimate forward outcomes (to help overcome the small sample size problem).
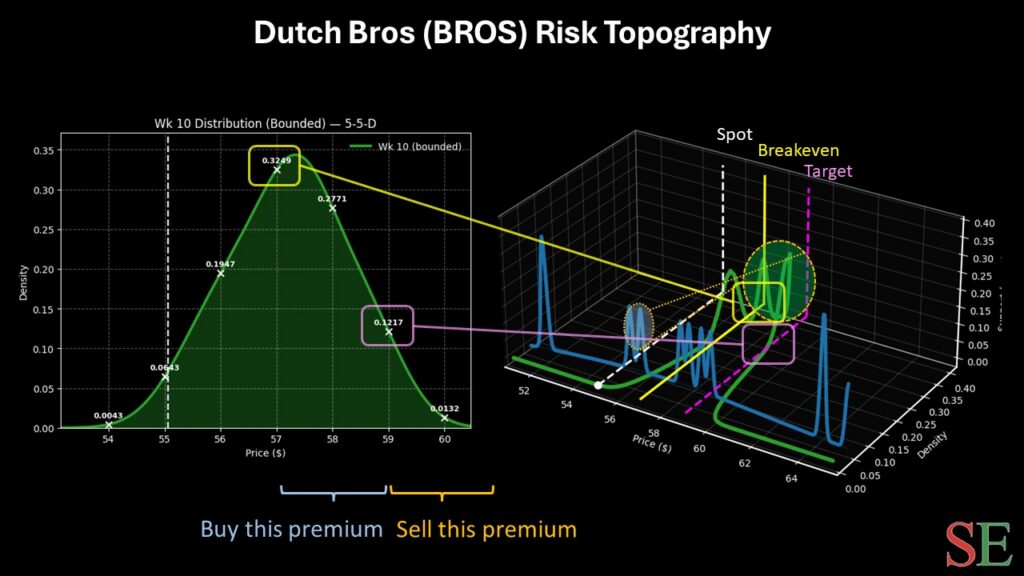
Through the above process, the forward 10-week returns can be calculated to land between $53 and $61, with probability density peaking around $57.30. From a speculative point of view, we’re betting that the potential catalyst of the Q4 earnings report will help materialize this range (which again would normally take 10 weeks). Please note that our second-order (conditioned) dispersion is inside the range calculated by Black-Scholes.
To be fair, Markov-based analyses will always be controversial in the market because they represent a conditioned, theoretical output. In other words, you must accept the premise. However, if you want to stay non-controversial, Black-Scholes isn’t really telling you much (other than BROS stock can go up or it can go down).
In terms of a specific trading idea playing off the earnings report, I’d take a look at the 55/59 bull call spread expiring Feb. 13. This trade requires BROS stock to rise through the $59 strike at expiration to generate a 100% maximum payout. It’s super-aggressive, but the breakeven price sits at $57, thereby improving probabilistic credibility.
Leave a Reply