e.l.f. Beauty’s Q2 2026 earnings showcased a robust 14% surge in net sales to $343.9 million, fueled by the rhode acquisition and resilient core brand performance. Despite tariff pressures squeezing gross margins to 69%, adjusted EBITDA held at $66 million, with EPS beating estimates at $0.68.
Table of Contents
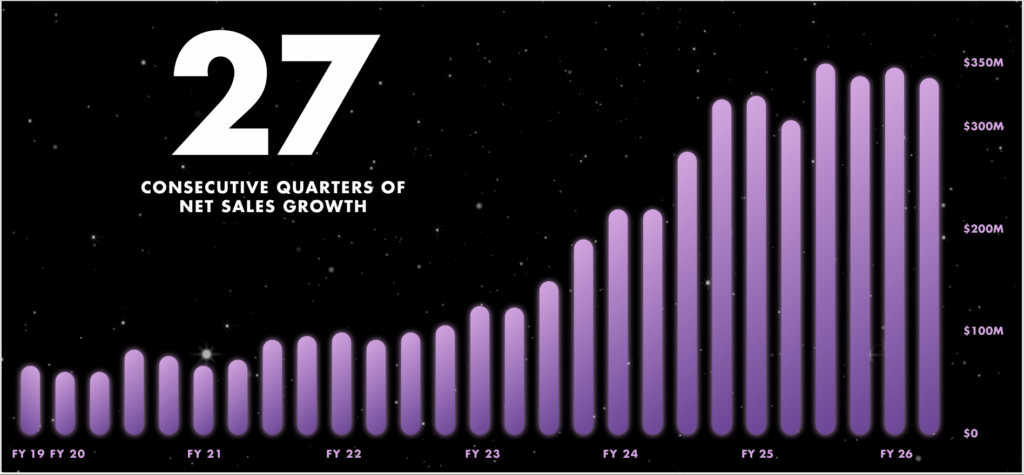
The quarter marked 27 straight periods of sales growth, as U.S. consumption for the e.l.f. brand tripled category averages at 7%. Management raised full-year guidance to 18-20% net sales growth ($1.55-1.57 billion) and adjusted EBITDA of $302-306 million, signaling confidence amid international expansion and digital investments.
Investors should note the rhode contribution of $52 million, which masked a -3% organic decline tied to shipment timing. This Q2 2026 earnings report underscores e.l.f. Beauty’s playbook execution in a value-driven cosmetics market.
Rhode Acquisition Fuels Growth
The Q2 2026 earnings spotlighted the transformative rhode acquisition, adding $52 million—or 17 points—to net sales growth. This bolt-on deal with Hailey Bieber’s brand enhances e.l.f. Beauty’s prestige portfolio, launching successfully at Sephora and driving 140 basis points of U.S. market share gains.
CEO Tarang Amin highlighted rhode’s accretive potential long-term, despite near-term SG&A ramps from integration costs. E-commerce sales jumped 39%, while retailer channels grew 9%, with U.S. net sales up 18% and international at 2%. Balance sheet strength persists with $194 million in cash and leverage under 2x post-deal. For investors, this move diversifies beyond the mass market into higher-margin skincare, positioning e.l.f. for sustained 20%+ growth.
Margins Pressured by Tariffs
Tariffs emerged as the key headwind in Q2 2026 earnings, eroding gross margins by 165 basis points to 69% and contributing to a 4% adjusted EBITDA dip. Management flagged a 60% average tariff rate for fiscal 2026—double last year’s—equating to a $17 million hit per 10-point increase. Operating income fell to $7.7 million from $27.9 million, amplified by marketing spend shifts and compensation hikes.
Yet, pricing discipline and volume gains cushioned impacts, with H2 gross margins eyed at 71%. Full-year marketing/digital spend rises to 24-26% of sales, prioritizing share recapture. Investors tracking e.l.f. Beauty’s efficiency should monitor tariff resolutions and supply chain shifts for margin recovery.
What Do the Charts Say About ELF Stock?
ELF stock trades around $86 as of early February 2026, below its 200-day SMA of $103 but above the 50-day SMA of $81. However, the stock is flashing mixed signals with the MACD at 16.07, and RSI near 51 (not shown) suggests building bullish momentum amid buy signals from shorter EMAs.

Post-earnings, shares dipped despite EPS beats, reflecting organic sales concerns, but analyst targets average $117-126 with 23-40% upside. Bollinger Bands indicate a potential breakout above $90 resistance. Volume supports accumulation near supports.
Where the Thesis Could Go Wrong
Organic sales declining 3% signal core e.l.f. brand vulnerability if retailer inventory destocking persists or category promotion intensifies. Escalating tariffs could prolong margin compression beyond H2 guidance, especially if trade policies harden under the current administration.
Rhode integration risks—overstated synergies or Bieber brand fatigue—might inflate SG&A without revenue offsets. Macro slowdowns in discretionary spending could hit value cosmetics hardest, eroding 210bps share gains. Heightened competition from prestige players adds execution risk.
ELF Stock Q2 2026 Earnings Affirms Growth Path
e.l.f. Beauty’s Q2 2026 earnings affirm a growth powerhouse via rhode and share mastery, with raised FY guidance validating the thesis. Navigate tariffs and organics vigilantly for 20%+ upside. Hold or accumulate on dips.
Leave a Reply