
There’s no question that Micron Technology (NASDAQ: MU) represents one of the strongest names in the technology ecosystem. Just in this year alone, MU stock has gained over 41% of value, while in the past 52 weeks, the security has stormed to a return of about 353%. Even among high-flying innovators like Nvidia (NASDAQ: NVDA), Micron’s performance has been nothing short of impressive.
Table of Contents
At the same time, the kinks in the armor are conspicuous. Recently, the tech sector has struggled for traction, with MU stock in particular losing about 2% in the trailing month. NVDA is down about 3% during the same frame. Perhaps most worryingly, Nvidia saw its shares sell off despite a historic fourth-quarter earnings beat and strong guidance.
Despite the encouraging results, investors engaged in profit-taking amid elevated expectations in the artificial intelligence domain. Yes, data center revenue surged to astounding levels, which in theory should help NVDA stock. However, the security still incurred red ink, largely due to concerns over high valuations and potential “capex fatigue” from hyperscalers.
When even the most exciting innovation needs a breather, this framework isn’t exactly the most encouraging for Micron stock ahead of the company’s fiscal Q2 earnings report (scheduled for release on March 18). On paper, analysts are looking for earnings per share of $8.56 on revenue of $19.11 billion, which represents highly ambitious but rational targets given the semiconductor specialist’s outstanding performance. Still, the ultimate question comes down to what the market will bear.
In other words, the issue really isn’t whether Micron can deliver the goods — I think most of us believe that the company will exceed expectations. No, the concern centers on the broader public sentiment. MU stock has had ample opportunities to break convincingly above the $400 level but has generally failed to do so.
When looking at the smart money’s risk positioning, we find pensiveness rather than directional conviction.
Volatility Skew Presents a Cautious Tale for MU Stock
Very few among the professional class are pounding the table on MU stock, at least according to the volatility skew. By definition, the skew identifies implied volatility (IV) — or a stock’s potential range of motion — across the strike price spectrum of a given options chain. In short, this screener showcases the surface-area distortion of volatility space, allowing retail traders to better understand the smart money’s risk positioning.
In colloquial terms, the skew acts as a radar gun, with spikes indicating areas of concern that traders seek to cover. Regarding the March 20 monthly expiration date (the options chain closest to the Q2 earnings report), the skew is relatively flat for the strikes surrounding the spot price. Basically, there’s very little urgency to cover the most likely price undulations based on spot proximity.
Where the real action in the skew occurs is in the edges, specifically the left-hand side (toward lower strikes). Notice that at the peak, put IV soars to a peak level of nearly 864%. This setup suggests that the net priority among smart money traders is to mitigate the impact of extreme downside tail risk. If MU stock collapses, sophisticated market participants stand ready with put options that serve as insurance products.
On the right end as well, put IV happens to rise above call IV. That’s significant because it implies that smart money traders are protecting their actual long exposure to MU stock with synthetic shorts (deep in-the-money puts). This risk structuring also points to a lack of positioning for upside convexity. That’s a complicated way of saying that you’re not seeing much long-side speculation.
In sports terms, the smart money is sitting on the lead and hoping to ice out the game rather than padding the stat book with garbage points.
To be clear, the smart money is transactionally sophisticated rather than having gifts of prescience. Still, when those folks with the greatest resources are refusing to be bullish on MU stock, that’s a signal worth pondering.
Inductive Analysis Points to an Unideal Posture for Micron Stock
Beyond volatility skew, I believe the most convincing evidence comes from the inductive approach, which is a fancy way of saying “pattern recognition.” Essentially, the theory is that the equities market operates under a Markov property. What may happen in the future largely hinges on what is happening right now.
Stated differently, if a stock is riding a massive upside wave, the forward probabilities are likely going to be different from the same stock succumbing to a corrective cycle. Right now, Micron stock is one of the hottest names on the planet. That’s a completely different paradigm from just a few years ago.
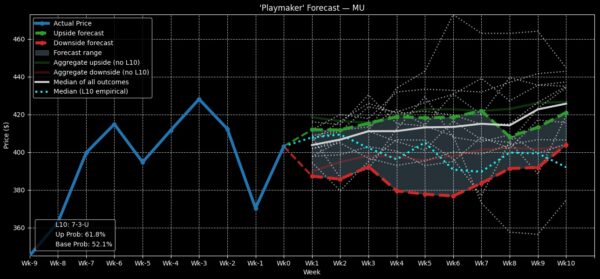
So, where am I going with this? Using data going back to January 2019, MU stock would be expected to range between $390 and $440 over any random 10-week period. However, we’re not interested in analyzing MU stock based on aggregate data; we’re looking for the distribution tied to a specific market signal.
In the past 10 weeks, Micron printed seven up weeks, leading to an overall upward slope. That’s a bullish-centric signal, and as such, we would expect a statistically different distribution. Using the inductive approach, we can calculate the forward 10-week returns under this specific signal as landing between $380 and $420, with probability density peaking just south of the current spot price.
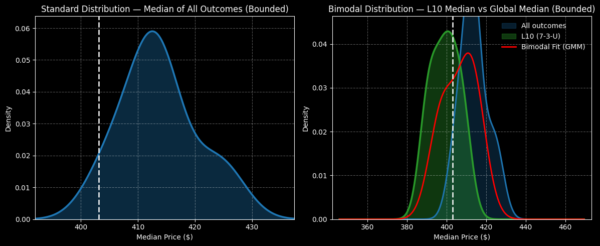
The aforementioned distribution is based on median price estimates. In reality, the actual figure could be much steeper, especially following a market-moving event like earnings. Ultimately, the point here isn’t so much about trying to isolate a picture-perfect forecast; rather, it’s that the risk profile for long-side debit traders is unfavorable.
Combined with the pensive data from the volatility skew, Micron stock appears to be sending warning signals.
Identifying a Trade Idea
Quite frankly, I don’t relish the idea of giving an opinion on Micron stock, given how popular the name is. Still, if forced to give an answer, I would be looking at the 387.50/380.00 bear put spread expiring March 20.
Basically, for the trade to be fully profitable, MU stock would need to fall through the $380 strike at expiration. Doing so would generate a maximum payout of more than 105%. Overall, the net debit required isn’t too bad, which is $365 (the most that can be lost).
For the most part, the above approach anticipates continued tiredness in the AI ecosystem. While it’s an aggressive trade, it’s not unreasonable, as even the smart money isn’t exactly optimistic about immediate growth in MU stock.
Leave a Reply