
Let’s just be brutally honest: Best Buy (NYSE: BBY) faces a critical earnings test for its upcoming fourth-quarter disclosure. Two factors make the print especially high stakes. First, the broader economy — save for an elite few enterprises in artificial intelligence — appears to be struggling, which obviously carries heavy implications for big-box-retailing names like BBY stock. Second, other big-name retailers like Target (NYSE: TGT) are also set to disclose their results.
Table of Contents
So, it’s not just a matter of delivering the goods; Best Buy also has to keep pace with other companies desperate for relevance. It’s looking to be a feisty earnings season for retail, which has caused some unusual rumblings in the options market.
Before heading into that bit, let’s quickly recap what Best Buy is expected to post up in terms of headline stats. For the Q4 disclosure — scheduled for Tuesday before the opening bell — analysts anticipate that the big-box retailer will post earnings per share of $2.47 on revenue of $13.91 billion. In the year-ago quarter, Best Buy managed to print EPS of $2.58 on revenue of $13.95 billion, beating the consensus targets of $2.40 and $13.66 billion, respectively.
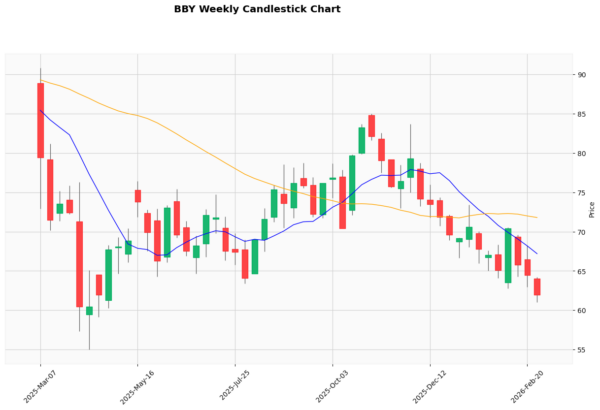
Unfortunately, the performance of BBY stock has not been cooperative, losing roughly 29% in the past 52 weeks. Still, what makes BBY intriguing to some speculators is the non-ergodic nature of its return profile. Basically, the security sees pockets of directional biases which bold options traders could potentially exploit — and that’s the goal we’re trying to achieve here.
Volatility Skew as Vital Intel on BBY Stock
As I’ve mentioned in prior articles for StockEarnings.com, one of the most important pieces of first-order (observational) data that’s freely available to retail traders is volatility skew. Definitionally, the skew is a screener that identifies implied volatility (IV) — or a stock’s potential range of motion — across the strike price spectrum of a given options chain.
In simple language, the skew is a visual representation of surface-area distortion of volatility space, which allows retail traders to understand how the smart money is positioned for risk. Think of this tool like the starting formation of a soccer team. By analyzing the formation, you understand the coaching philosophy of the team you’re facing, such as being offense-minded or defensive.
In the case of Best Buy stock, the skew for the March 6 weekly options chain (the closest one following the retailer’s Q4 disclosure) is strongly hedged on both ends of the strike price boundaries. I’d characterize this setup as a 5-3-2 formation in soccer, with the skew featuring hedging activities to both guard against big drops in price while also positioning for upside convexity.
Put simply, the smart money doesn’t seem to have much directional conviction here, which makes BBY stock an enticing opportunity for aggressive speculators. If you’re one of the folks that believe sophisticated market participants are generally more prescient than average traders, Best Buy’s derivative market signals aren’t giving much up.
To find a deeper answer, we need to use some math to narrow down the list of possible outcomes.
Establishing the Realistic Parameters of Best Buy Stock
One of the quickest ways to get a reference point for where an optionable security may head next is the Black-Scholes-derived expected move calculator. For the March 6 expiration date, the calculator estimates a dispersion between $56.16 and $67.34.
While this range does seem useful, it’s merely a presuppositional reference point. The core problem with Black-Scholes-based calculations is that the forecasted figures are only “true” relative to the framework. In other words, Black-Scholes is a static formula that never changes, irrespective of the context the target security finds itself in.
For example, whether BBY stock just ripped out a 50% gain over the past week or suffered a 35% loss, it doesn’t matter; you would still use the same Black-Scholes formula. But my contention is that a stock that just ripped massively will be statistically treated differently than one that suffered a catastrophic loss.
It’s really common sense. For a high-performance stock, the main concern is holding the bag. For a negative-performance stock, the main concern is injury from falling knives. But in Black-Scholes world, none of this context is figured into the formulation.
I find that to be absurd and that’s the reason why I depend on the Markov property.
Drilling into a Better Answer
Not only is Black-Scholes just a reference point but the whole “expected move” calculation is tactically rudderless. It basically amounts to a formula that declares that the target security can go up or it can go down. That’s not analysis; that’s tautology.
Going back to the Markov property, the principle asserts that the future state of a system depends solely on the current state. In other words, transitions from one state to another depend heavily on the present context. For example, if you’re holding onto a two-goal lead late in the game, you’ll probably have a better chance of winning than if you were behind by two goals.
In the equities market, I theorize that different market structures will have an influence on forward distributions. For example, using data from January 2019, I calculated that the average 10-week distribution for BBY stock would land the security between $61.50 and $62.40, with probability density peaking around $61.85. Basically, BBY suffers from a negative bias under aggregate conditions.
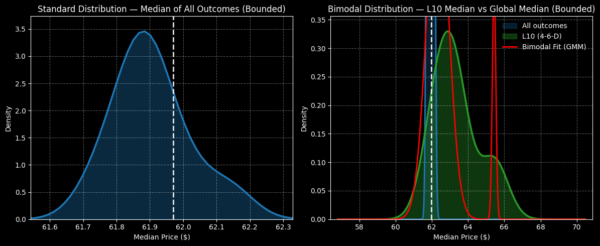
However, under 4-6-D conditions — that is, when BBY in the past 10 weeks prints only four up weeks and an overall downward slope — the distribution would be expected to shift positively. In this case, BBY would likely land between $60 and $68, with probability density peaking at around $63.
Now, with Q4 earnings just around the corner, my belief is that these momentum trends that could take several weeks to materialize may see a compressed revaluation. With that in mind, I’m tempted by the 63/65 bull call spread expiring March 6.
This wager requires a net debit of $91, which is the most that can be lost. Should Best Buy stock rise through the $65 strike at expiration, the maximum payout would be nearly 120%. Breakeven lands at $63.91, helping to improve the trade’s probabilistic credibility.
Leave a Reply