NVIDIA (NASDAQ: NVDA) may very well represent the most important earnings disclosure this season, with the tech juggernaut facing a critical fourth-quarter test. In prior years, NVDA stock simply catapulted off the tremendous demand tied to artificial intelligence. Fast forward to the present day, and one of the pressing concerns is the growing anxiety of a bubble brewing in the innovation space.
Table of Contents
Given that so much of the capital growth that has been witnessed in the equities sector is concentrated among a few elite enterprises, theoretically, it wouldn’t take much for this digital house of cards to tumble back down to earth. It’s not that generative AI is a defective or overly hyped invention; it’s more that the valuation may have gotten out of touch for most investors’ appetites.
Whatever the case, we’re going to find out whether NVIDIA can continue delivering the goods in an environment of heightened expectations. When results come in on Wednesday after the close, analysts will be looking for earnings per share of $1.50 on revenue of $65.64 billion. In the year-ago quarter, the company posted EPS of 89 cents on revenue of $39.33 billion, beating expectations calling for 84 cents and $38.04 billion, respectively.
For investors, the main talking point is whether NVDA stock can still appeal to a jaded marketplace. In the past six months, the security has gained less than 6%. Having been caught in a sideways consolidation pattern, it needs something big to break the tech giant out of its funk.
Volatility Skew Provides Critical Intel for NVDA Stock
Among the most important datapoints that a retail trader may consider is arguably the volatility skew. Definitionally, the skew identifies implied volatility (IV) — or a security’s potential range of movement — across the strike price spectrum of a given options chain. Colloquially, the skew represents the surface area distortion of volatility space, which may signal the smart money’s positional bias.
If an options chain featured no sentiment bias whatsoever, the skew would be perfectly flat. However, for a popular entity like NVDA stock, the constant tug-of-war in the system distorts where insurance premiums are being priced the heaviest. In other words, the skew reflects the areas of deepest concern among institutional and professional traders.
Regarding the Feb. 27 expiration date (which would be the Friday following the Q4 earnings disclosure), the skew is relatively calm around the strikes near the current spot price. Admittedly, the curvature rises conspicuously to the left (toward lower strikes), meaning that traders believe that a corrective spell represents a non-trivial risk. However, the lift is gradual and controlled, indicating no unusual urgency for downside protection.
Fast forward to the March 20 expiration date, and we again see that the skew is calm for strikes near the spot price. Again, it’s only at the far-left boundaries where the skew curves upward. As with the Feb. 27 chain, the rise is orderly, indicating a lack of overt urgency.
It’s also interesting that on the right boundaries, the skew appears relatively flat. This setup tells me that the net prioritization is not to be caught off guard to the downside. As such, bullish expression through calls could be relatively cheap.
Establishing the Trading Parameters of NVIDIA Stock
While we now have a broad understanding of the smart money’s transactional bias, we still need to translate this data into actual price outcomes. For that, we may turn to the Black-Scholes-derived expected move calculator. Wall Street’s standard mechanism for pricing options anticipates that for the March 20 expiration date, NVIDIA stock may land between $171.90 and $208.10.
Where does this dispersion come from? Black-Scholes assumes a world where stock market returns are lognormally distributed. Under this framework, the above range represents where NVDA stock may symmetrically land one standard deviation away from spot (while accounting for volatility and days to expiration).
Mathematically, the model asserts that in 68% of cases, we would expect NVIDIA stock to trade somewhere within the prescribed range when March 20 rolls around. That’s a reasonable assumption, especially since an outstanding catalyst would be required to push a security beyond one standard deviation from spot.
Still, we’re left with a breakdown of how the market is merely pricing uncertainty; we don’t know if that pricing is actually justified. To better determine justification, we need to turn to a second-order analysis for further insights.
This is where my search-and-rescue (SAR) analogy does a lot of conceptual heavy lifting. If NVIDIA stock were a lone shipwrecked survivor, then Black-Scholes would be a satellite system that picked up a distress signal somewhere in the Pacific Ocean. Using theoretical drift patterns, we can plot a realistic search radius from the point of the distress signal.
Unfortunately, because we live in a world of limited resources, we can’t cover every square inch of this radius. To estimate where NVDA stock may be, we need to rely on probabilistic math.
That’s where the Markov property becomes invaluable.
Narrowing NVIDIA’s Probability Space
Under Markov, the future state of a system depends entirely on the present state. In other words, forward probabilities should not be calculated independently but be assessed in context. Using the SAR analogy above, different ocean currents — such as choppy waves versus calm waters — will likely influence where a shipwrecked survivor may drift.
This is how the Markov property is relevant to NVIDIA stock. In the past five weeks, NVDA printed three up weeks, leading to an overall upward slope. There’s nothing special about this 3-2-U sequence, per se. However, this quantitative signal represents a unique ocean current, and survivors caught in these waters would be expected to drift in a particular manner.
From here, we can use enumerative deduction and Bayesian-inspired inference to help estimate forward drift patterns based on past analogs of the aforementioned quant signal. In full transparency, you should realize that the future is not necessarily compelled by the past. However, I would argue that induction is operationally unavoidable.
All other standardized financial methodologies — fundamental, technical, quantitative — are inductive by nature. My counterargument would simply be that under second-order frameworks, the Markov approach arguably utilizes the fewest assumptions.
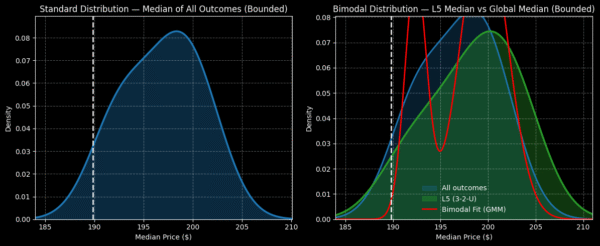
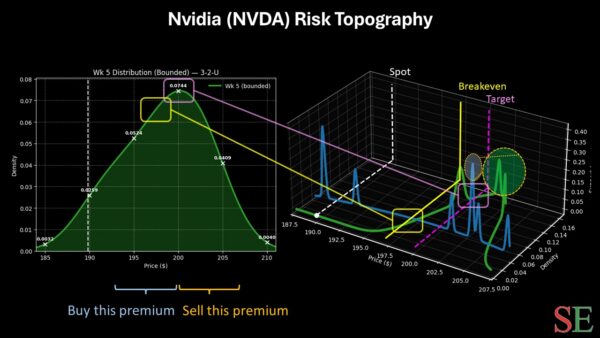
If you accept the premise above, NVDA’s forward five-week returns can be estimated to range between $180 and $215, with probability density peaking near $200. As such, I’m tempted by the 195/200 bull call spread expiring March 20.
For this wager to be fully profitable, NVDA stock must rise through the $200 strike at expiration. If this strike is triggered, the maximum payout would exceed 138%. Breakeven lands at $197.10, helping to improve the trade’s probabilistic credibility.
Leave a Reply