
Newmont (NYSE: NEM) is simply on a tear these days and for good reason. With demand for precious metals skyrocketing amid rising concerns regarding economic and societal stability, it’s only natural that gold mining names like NEM stock partake in the rally. Unlike the physical assets themselves, owning equity shares of gold producers represents a much more convenient form of exposure.
Table of Contents
So far, the performance has been undeniable. Last Friday, before the long weekend, NEM stock popped up 6.5%. Since the beginning of January, the security has gained just under 26%. Over the past 52 weeks, the world’s largest gold mining corporation saw its equity rise by almost 165%. Nevertheless, this dramatic ascent raises at least near-term sustainability concerns.
Essentially, the mean reversion concept can also work against the bulls. After enjoying so many positive performances, the latest news has to be that much more robust to justify a continuation of the bull trend. As such, there’s a serious risk that, while the upcoming fourth-quarter earnings report — scheduled for release on Feb. 19 — will likely generate a beat, it may not be enough to impress Wall Street.
Just looking at the stats, analysts expect Newmont to post earnings per share of $1.94 on revenue of $6.05 billion. In the year-ago quarter, the gold miner posted EPS of $1.40 on revenue of $5.65 billion, beating the consensus target of $1.03 and $5.32 billion, respectively. Notably, the Q4 2025 report started the streak of four consecutive top-and-bottom-line beats.
Just based on current momentum, I don’t anticipate the fifth time around breaking the streak. For me, the question is whether the magnitude of the beat will be significant enough. Frankly, I’m not too sure.
Volatility Skew Presents a Pensive Case for NEM Stock
One of the most important first-order (observational) indicators that retail traders should consider for optionable securities is volatility skew, primarily for the reason that it can provide clues regarding smart money positioning. Definitionally, volatility skew is a screener that identifies implied volatility (IV) — or a stock’s potential kinetic output — across the strike price spectrum of a given options chain.
For the Feb. 20 expiration date (a day after Newmont’s earnings), the overall posture of the skew is relatively calm and unremarkable. This assessment largely comes down to how flat the put and call IV curvature is in the strikes near the spot price. Further, the lack of discrepancy or spread between puts and calls suggests a lack of urgency in hedging against NEM stock.
Frankly, that’s not surprising because of the strong performance of the gold miner. Between the emotions of fear and greed, the market clearly favors the latter. Still, what is interesting is the dynamic witnessed in the skew’s left wing.
Basically, put IV curves upward as the strike price decreases, suggesting a prioritization for far out-the-money (OTM) puts. Also, notice that relative to the spread in other areas of the skew, the discrepancy between the put IV up top and the call IV at the bottom is conspicuous. In this case, we may have a mild but distinct emphasis on protecting against downside tail risk.
Most likely, I will get criticized by options traders for perhaps reading too much into the left-wing dynamics. However, I find it interesting that while the IV spread between calls and puts is super tight from $80 and above, from around $75 and below, the spread noticeably widens.
It’s not the end of the world, but it’s also very much worth monitoring.
Identifying the Trading Parameters of Newmont Stock
While we now have a working understanding of smart money sentiment, we still need to figure out how this translates into actual price outcomes. For that, we may turn to the Black-Scholes-derived expected move calculator. Wall Street’s standard mechanism for pricing options projects that for the Feb. 20 expiration date, Newmont stock may land between $116.69 and 134.71.
Where does this dispersion come from? Black-Scholes assumes a world where stock market returns are lognormally distributed. Under this framework, the above range represents where Newmont stock may symmetrically land one standard deviation away from spot (while accounting for volatility and days to expiration).
Mathematically, the model asserts that in 68% of cases, we would expect Newmont stock to trade somewhere within the prescribed range at the end of the week. That’s a reasonable assumption because it would take an extraordinary catalyst to drive a security beyond one standard deviation from spot. Still, we’re also talking about a hefty peak-to-trough range of over 15%.
Put another way, after Newmont’s Q4 earnings, NEM stock can move up 7.17% or move down 7.17%. And at this stage, we’ve really arrived at the maximum utility of first-order analyses. In order to extract any more insight, we would need to conduct a second-order analysis, which would condition the observed data on empirical anchors.
Conceptually, we are faced with the classic search-and-rescue (SAR) conundrum. Imagine that NEM stock symbolizes a lone shipwrecked survivor. Black-Scholes has identified a distress signal that went out somewhere in the Pacific Ocean, and it has also established a realistic search radius. Unfortunately, given our limited resources, we cannot cover the entire search area.
Where does this leave us? There’s really only one solution, and that is to use probabilistic math. It’s here where the Markov property comes into frame.
Narrowing the Probability Space
Under Markov, the future state of a system depends entirely on the present state. Colloquially, forward probabilities should not be calculated independently but should be assessed in context. Using the SAR analogy above, different ocean currents — such as choppy waves versus calm waters — will likely affect where a shipwrecked survivor is likely to drift.
Here’s how the Markov property is relevant to Newmont stock. In the past 10 weeks, NEM stock printed nine up weeks, leading to an overall upward slope. There’s nothing special about this sequence, per se. However, this quantitative signal represents a specific type of ocean current. As such, survivors caught in these waters will likely drift differently compared to any other current.
To really emphasize the point, Newmont stock printed nine up weeks in the last 10 weeks. That means to justify another set of up weeks requires a truly special catalyst — much more than gold being awesome. Such low-hanging fruit has already been plucked and is already baked into NEM stock.
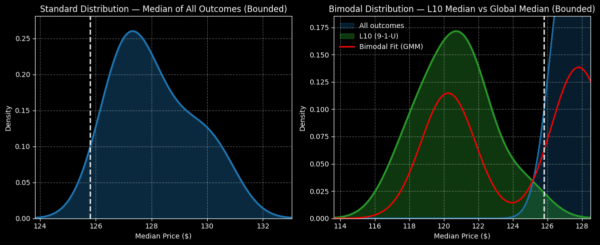
Using enumerative induction and Bayesian-inspired inference, we can estimate where the stock is likely to drift based on prior manifestations of the 9-1-U sequence. Basically, we would take the median pathway associated with the quant signal and apply it to the current spot price.
When we do that, the resultant distribution is quite negative, with prices expected to land between $114 and $128 over the next 10 weeks. Under aggregate conditions, we would anticipate the forward 10-week range to land between $124 and $133.
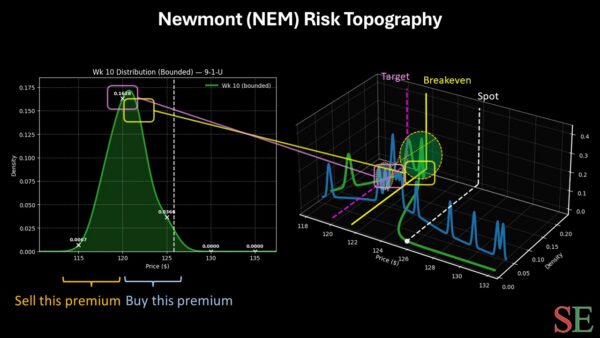
If Newmont doesn’t impress in Q4, I wouldn’t be surprised to see NEM stock drift between $118 and $123, roughly the bottom-third level of the Black-Scholes dispersion.
Of course, we’re talking about a highly risky trade. But if you want to take it, the 123/120 bear put spread expiring Feb. 20 is available. If NEM stock falls through the $120 strike at expiration, the maximum payout would be almost 110%. Breakeven lands at $121.57, improving the trade’s probabilistic credibility.
Leave a Reply