
Eli Lilly (NYSE:LLY) may very well represent a compelling scalping opportunity that very few people see coming. Lightly anchoring the upside belief in LLY stock is a technical pattern known as the bullish flag formation. After sharply rising since late October last year, LLY entered a sideways consolidation between late November to now, representing the “flag.”
Table of Contents
At the culmination of the consolidatory action, however, a breakout move could materialize. Now, I’m not a big fan of technical analysis as I now find the discipline to be largely built on unfalsifiable heuristics. That said, the potential breakout could come in the form of a major catalyst: positive results stemming from this Wednesday’s fourth-quarter earnings report.
On paper, Wall Street analysts will be looking for earnings per share to hit $6.96 on revenue of $17.9 billion. In the year-ago quarter, the healthcare juggernaut posted EPS of $5.32 on revenue of $13.53 billion, beating the consensus targets of $5.08 and $13.43 billion. Generally speaking, Eli Lilly tends to exceed expectations, so observers will likely have some confidence in the company.
For proper context, LLY stock has enjoyed a robust performance, and it’s not purely based on technical speculation. In the past five years, LLY has moved up 414% and that’s largely off the back of an impressive expansion of the top line. For example, in Q4 of 2022, sales grew only 7.53% year-over-year. If Eli Lilly hits its mark this time around, growth would reach over 32% YOY.
Still, the main concern among smart money traders is that most of the optimism is already baked in. Technically, LLY stock has gained 28% in the trailing 52 weeks, which is a very solid performance. It’s not clear, then, that the upside hasn’t been baked in. Nevertheless, I’m fascinated by the bull flag amid other compelling contexts.
Volatility Skew Reveals Potentially Discounted LLY Stock Call Options
Before diving into higher-level analyses, it’s important to exhaust all available first-order insights. One of the most informative is volatility skew, which identifies implied volatility (IV) for the strike price spectrum of a given expiration date.
In the case of the Feb. 20 options chain, the volatility skew for LLY stock primarily shows a controlled smile of both the put-side IV and the call-side IV, with the puts dominating the overall proceedings. Effectively, this framework implies that the main priority among smart money traders is downside protection and insurance.
On the upper price boundaries, put IV is conspicuously above calls, which mechanically functions as a short position against LLY stock. Now, I don’t believe that these institutional investors are net short Eli Lilly per se. Rather, the motivation is likely to protect their long-side exposure against downward volatility. I believe this structure is significant because it suggests that the smart money still wants to participate in LLY; it just wants to do so hedged.
On the other end of the spectrum, put IV is also elevated at the lower boundaries. This setup possibly indicates the purchase of tail risk. Essentially, it’s possible that Eli Lilly stock could tumble from its bull flag formation. If the technical setup fails, then the anticipated breakout move could easily go the wrong direction. Again, I think it’s telling that the smart money, instead of selling LLY outright, is buying insurance instead.
To be sure, volatility skew can only show so much. While we understand the hedging motivations of sophisticated market participants, we don’t have any idea of where LLY stock may end up. That’s because the distortions that we see in the skew do not necessarily represent the strike prices where demand is concentrated. Instead, the curvature stems from a surface-level distortion arising from holistic trading activity.
For further insight into the actual kinetic parameters of LLY stock, we must consider another analysis.
Laying Out the Battlefield for Eli Lilly Stock
While we may understand certain sentiment nuances of the smart money, we need a way to translate this data into actual insights. For the initial step, we can turn to the Black-Scholes-derived expected move calculator. This model projects Eli Lilly stock to land between $952.22 and $1,120.84 for the Feb. 20 options chain.
Where did this dispersion come from? Black-Scholes assumes a world where stock market returns are lognormally distributed. Under this framework, the above dispersion represents how LLY stock would symmetrically fall one standard deviation from the spot price (while accounting for volatility and days to expiration).
What it boils down to is that Black-Scholes assumes that in 68% of cases, LLY will trade between roughly $952 and $1,121 when Feb. 20 rolls around. Although a very reasonable assumption, it’s not the most helpful dispersion because of its width. As debit-side traders, we would be required to cover the entire gap of the spectrum, which comes out to almost 18% ($1,120.84 divided by $952.22).
Fundamentally, the obstacle is that Black-Scholes calculates its projections independent of structure. That’s why no matter what context the model is used in, it always spits out a perfectly symmetrical envelope. However, forward probabilities are asymmetrical precisely because in the market, prior structure has an influence on forward pathways.
In order to narrow our projections, we need to condition forward probabilities based on the current market context. For that, we can turn to the Markov property.
Drilling into Second-Order Analyses
Under Markov, the future state of a system depends solely on the current state. That’s a fancy way of saying that forward probabilities should not be independently calculated but rather assessed under ecosystem context. To use a simple football analogy, a 20-yard field goal is an easy chip shot. Add snow, wind and playoff pressure, and these odds may change dramatically.
Again, the main difference between the Black-Scholes model and the Markov property is dependency. With the former, volatility is an independent input and context isn’t even integrated into the framework. With the latter, forward probabilities hinge on the current structure of the asset.
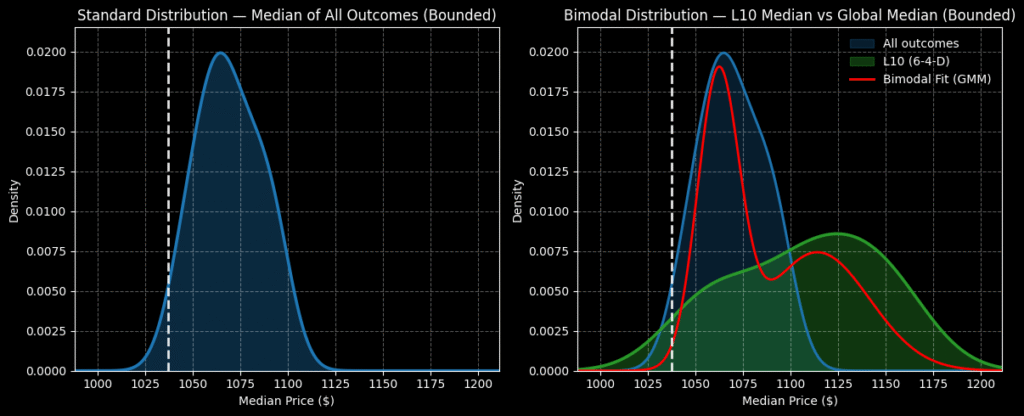
For LLY stock, in the last 10 weeks, the security printed six up weeks. However, the overall slope of this trend was downward. Using a combination of enumerative induction and Bayesian-lite inference, we can see that under 6-4-D conditions, LLY’s forward probability radically changes from normal expectations. Over the next 10 weeks, we would anticipate the stock landing between $1,000 and $1,200, with probability density being prominent at $1,125.
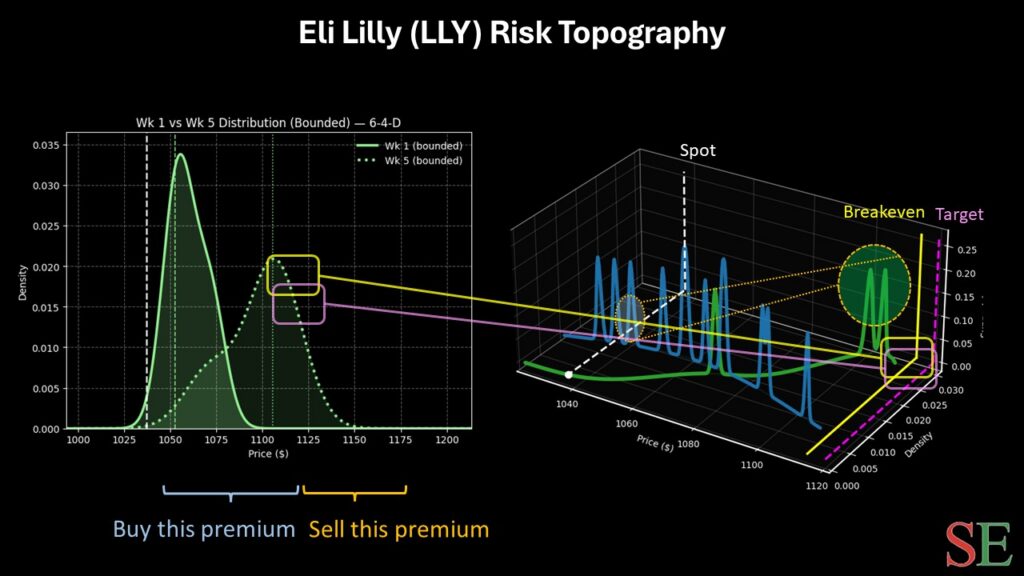
Over the next five weeks, LLY stock is likely to range between $1,025 and $1,150, with the probability density peaking between $1,090 and $1,117. What’s interesting here is that my probabilistic range doesn’t actually conflict with the dispersion that Black-Scholes provided. Instead, it narrowed the likely landing zone to a much tighter range.
With this information, I’m liking the 1,110/1,120 bull call spread expiring Feb. 20. The net debit required is relatively cheap compared to the other spreads at $460. Should LLY stock rise through the $1,120 strike at expiration (which is not an unrealistic target), the maximum profit would be $540, a payout of over 117%. Breakeven comes in at $1,114.60, adding to the trade’s probabilistic credibility.
Leave a Reply