
Hims & Hers Health (NYSE:HIMS) appeared promising following an explosive rise in market value in 2025. Unfortunately, the end result was pure chaos for HIMS stock, with the security gyrating wildly throughout most of the year. But since late September, HIMS has been in a near freefall. Sadly, there doesn’t seem to be much evidence that circumstances will improve anytime soon.
Table of Contents
Another problematic element is that Hims & Hers is scheduled to release its fourth-quarter earnings report next Monday after market close. One would imagine that anything short of a stellar print could be an excuse for stakeholders to continue selling HIMS stock.
For the upcoming disclosure, analysts expect the telehealth specialist to post earnings per share of 3 cents on revenue of $619.08 million. In the year-ago quarter, the company posted EPS of 11 cents on revenue of $481.14 million, beating the consensus target of 10 cents and $470.31 million, respectively.
Overall, while the bottom-line performance has been mixed relative to analysts’ expectations, Hims & Hers generally tends to beat on the growth end. Since 2021, the company has only missed once, in Q2 2025. Still, what investors are looking for now may be supreme performance.
At least as far as the smart money is concerned, skepticism appears to be creeping in.
Volatility Skew Points to Increased Downside Hedging for HIMS Stock
Earlier in December, circumstances appeared to potentially be ripe for a risky but intriguing comeback opportunity. During a 10-week run, three of the weekly candlesticks were positive. Under these circumstances, the historical backdrop suggested that HIMS would bounce higher. That didn’t happen, suggesting that a major sentiment regime shift may have transpired.
Shockingly, over the past 11 weeks, only one weekly candlestick was positive. This situation helps solidify the possibility that HIMS stock is simply in a meltdown mode. As such, I’m not sure it’s wise to attempt to catch falling knives, especially when the smart money is busy protecting its flanks.
Volatility skew really tells the tale. This screener identifies implied volatility (IV) — or a stock’s potential kinetic output — across the strike price spectrum of a given options chain. For the March 20 expiration date, the main focus seems to be on downside volatility protection.
While the immediate strikes near the spot price feature a flat skew, the curvature on the left side (toward decreasing strike prices) rises sharply higher to 300%. The rate of ascent suggests that while the hedging isn’t necessarily panicked, the protective posture is prioritized. Basically, the smart money perceives a higher risk coming from bearish pressure.
On the right side of the skew (toward rising strike prices), put IV is noticeably elevated above call IV. Mechanically, these deep in-the-money (ITM) puts may serve as a synthetic short position, potentially to protect actual long exposure to HIMS stock.
Overall, while smart money traders are pricing in the possibility of some upside convexity, the main goal here is downside mitigation, just in case something snaps. With HIMS stock down more than 51% year-to-date, this posture is very reasonable.
Identifying the Trading Parameters of Hims & Hers Health Stock
While we now have a working understanding of smart money positioning, we still need to translate our findings into actual price outcomes. For that, we may turn to the Black-Scholes-derived expected move calculator. Wall Street’s standard mechanism for pricing options projects that for the March 20 expiration date, Hims & Hers Health stock may land between $12.37 and $19.43.
Where does this dispersion come from? Black-Scholes assumes a world where stock market returns are lognormally distributed. Under this framework, the above range represents where HIMS stock may symmetrically land one standard deviation away from spot (while accounting for volatility and days to expiration).
Mathematically, the model asserts that in 68% of cases, we would expect HIMS stock to trade somewhere within the prescribed range when March 20 rolls around. That’s a reasonable assumption, if only because it would take an exceptional catalyst to push a security beyond one standard deviation from spot.
Still, the main challenge is that we only know how the market is pricing uncertainty. We have not yet determined if that pricing is justified. To uncover this element requires second-order analyses, which take observational data and condition it relative to an empirical anchor.
In essence, we have a classic case of the search-and-rescue (SAR) conundrum. If HIMS stock symbolizes a lone shipwrecked survivor, then Black-Scholes is a mechanism that identified a distress signal that flashed somewhere in the Pacific Ocean. Through theoretical drift patterns, we can establish a reasonable search radius.
However, in a resource-constrained environment, we can’t afford to search the entire area. To get around this dilemma, we need to use probabilistic math to best estimate where HIMS might be found.
That’s where the Markov property comes into view.
Narrowing the Probability Space
Under Markov, the future state of a system depends entirely on the present state. Colloquially, forward probabilities should not be calculated independently but be assessed in context. Using the SAR analogy above, different ocean currents — such as choppy waves versus calm waters — will likely influence where a shipwrecked survivor may drift.
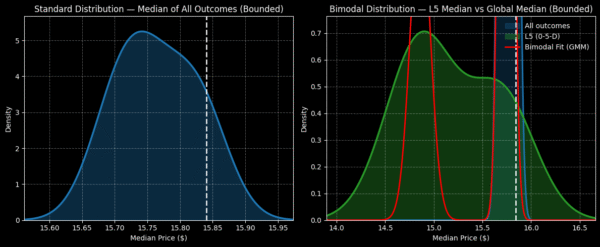
Here’s how the Markov property relates to Hims & Hers Health stock. In the past five weeks, HIMS printed no up weeks, leading to an overall downward slope. There’s nothing special about this 0-5-D sequence, per se. However, this quantitative signal represents a unique ocean current. Thus, any survivor caught in these waters would be expected to drift in a certain manner.
From here, we can apply enumerative induction and Bayesian-inspired inference to best estimate where HIMS stock may end up over the next five weeks. Basically, the idea is to use past analogs of the 0-5-D quant signal and apply it to the current spot price, thereby inductively mapping out a forward distribution.
Philosophically, it must be pointed out that David Hume famously noted that the future is not necessarily compelled by the past. However, if we take this criticism to the extreme, any inductive process — including gravity — would be deemed not logically necessary. My counterargument is that, when it comes to second-order analyses, the Markov property arguably utilizes the fewest assumptions.
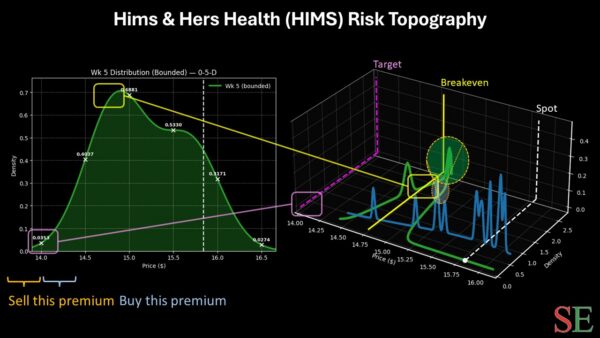
If you accept the premise above, we can calculate a likely forward five-week distribution between $13.50 and $17. Probability density would likely peak between $14.50 and $16, thus implying great risk for HIMS stock (which closed at $15.84 on Wednesday).
Given how the smart money is positioned (via the volatility skew), I would probably look at the 16/14 bear put spread expiring March 20. For this wager to be fully profitable, HIMS must fall through the $14 target, which is an aggressive target. If the strike is triggered, the maximum payout would exceed 65%. Breakeven lands at $14.79.
No, it’s not the most generous reward. However, with downside being prioritized, put options have simply accelerated in price. As such, a bear spread helps reduce the net capital required for the trade.
Leave a Reply