Ferrari (NYSE:RACE) represents one of the elite global luxury brands, making RACE stock an intriguing idea ahead of the company’s earnings disclosure (scheduled for Tuesday morning before the opening bell). A manufacturer of exotic vehicles and racing machines, Ferrari really needs no introduction. Further, because the company has its pulse on the desirability of ultra-wealthy consumers, its financial performance serves as a specialized benchmark.
Table of Contents
For the fourth quarter, Wall Street analysts expect Ferrari to print earnings per share of $2.44 on revenue of $2.02 billion. In the year-ago quarter, the luxury brand posted EPS of $2.28 on revenue of $1.85 billion, beating the consensus targets of $1.82 and $1.66 billion, respectively. Generally speaking, Ferrari delivers strong results. Between Q1 2023 through Q1 2025, the company posted nine consecutive top-and-bottom-line beats.
However, some weakness has started to creep in recently. For example, in Q2 2025, the company posted revenue of $2.03 billion, slightly missing the consensus estimate of $2.04 billion. It’s also worth noting that investors have become skeptical of RACE stock. Over the past 52 weeks, the security has slipped about 28%.
There’s a temptation to reflexively consider equity units that have suffered significant losses — especially celebrated names like Ferrari — as compelling discounts. While that could be the case, it’s important to consider main first-order analyses to gauge sentiment.
Tackling Smart Money Positioning for RACE Stock
One of the most valuable insights to extract from securities in the options market is volatility skew. This screener showcases implied volatility (IV) — or a stock’s potential kinetic output — across the strike price spectrum of a given options chain. For RACE stock, the March 20 expiration date reveals a setup that could be described as hedged optimism.
In the lower strike price boundaries, call IV stands noticeably above put IV (aside from the tail-end strike), with both skews curving upward. This structure indicates that traders are prioritizing long exposure to RACE stock via synthetic, leveraged means. It’s quite possible that this arrangement exists because it provides buyers with balance-sheet flexibility. With these derivative contracts, traders enjoy upside optionality without directly owning the security.
On the upper price boundaries, both put and call IV curves go upward as well, with call IV also rising above the put equivalent. This structure implies that while there are some mechanical short positions being placed (possibly to protect actual long exposure), the prioritization here is upside convexity.
It’s tempting to say that the skew shows true bullish intent. To respect the nuance, though, the reward of catching the upswing is perceived to be greater than the cost of suffering an additional downturn. This makes sense because the market already anticipates negative results. After all, RACE stock is down about 28% in the past year. If, on the other hand, Ferrari manages to pleasantly surprise, the subsequent pop would go against the prevailing trend.
As such, it’s completely understandable why the smart money would want some possibility of upside convexity.
Establishing the Trading Parameters of Ferrari Stock
While we now have a general understanding of smart money sentiment, we’re still at a loss as to how this may translate into actual price outcomes. For that, we may turn to the Black-Scholes-derived expected move calculator. Wall Street’s standard mechanism for pricing options projects that for the March 20 expiration date, Ferrari stock may trade between $305.05 and $363.37.
Where does this dispersion come from? Black-Scholes assumes a world where stock market returns are lognormally distributed. Under this framework, the above range represents where RACE stock may symmetrically fall one standard deviation away from spot (while accounting for volatility and days to expiration).
In effect, Black-Scholes is saying that in 68% of cases, we would expect RACE stock to trade within the prescribed range over the next 42 days. Mathematically, this assumption is reasonable as it would take an exceptional catalyst to drive a major security like RACE more than one standard deviation away from spot. Still, we’re left with a list of possibilities rather than probabilities.
It’s here that we have effectively reached the useful limit of first-order analyses or the datapoints that are freely available to everyone (and thus offer no real edge). Basically, Black-Scholes has identified that an SOS signal went out somewhere in the Pacific Ocean. While that’s useful information for a search-and-rescue (SAR) team, it also raises extreme challenges.
That’s still a large body of water to search. Given that we have limited resources (and sunlight), we need some way of probabilistically determining where RACE stock will likely be found within this vast surface area — this is the whole point of the Markov property.
Using Science to Narrow Down the Probability Space
Under Markov, the future state of a system depends entirely on the present state. Colloquially, forward probabilities should not be calculated independently but be assessed in context. Regarding the SAR analogy, different ocean currents — such as choppy waves versus calm waters — can easily influence where a shipwrecked survivor is likely to be found.
Here’s how we can use the Markov property for Ferrari stock. In the last 10 weeks, RACE stock printed only four up weeks, leading to an overall downward slope. There’s nothing special about this 4-6-D sequence, per se. However, the bigger point is that this quantitative signal represents a specific type of ocean current, which means shipwrecked survivors caught in these waters will likely encounter a certain type of drift.
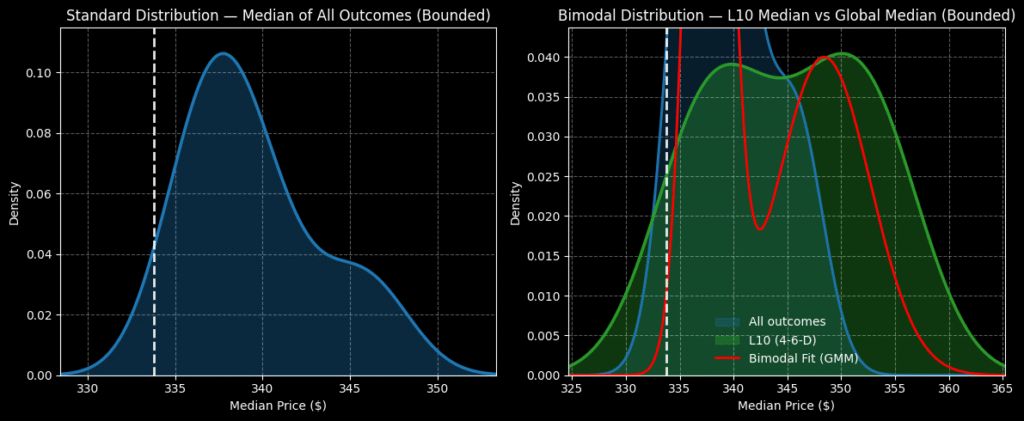
From here, the logical next step is to rely on enumerative induction. Basically, we would look back on prior occurrences of the 4-6-D sequence and estimate where RACE stock will likely end up over the next 10 weeks. Given that we’re dealing with limited sample sizes, we can use Bayesian-inspired inference to best estimate RACE’s probabilistic range.
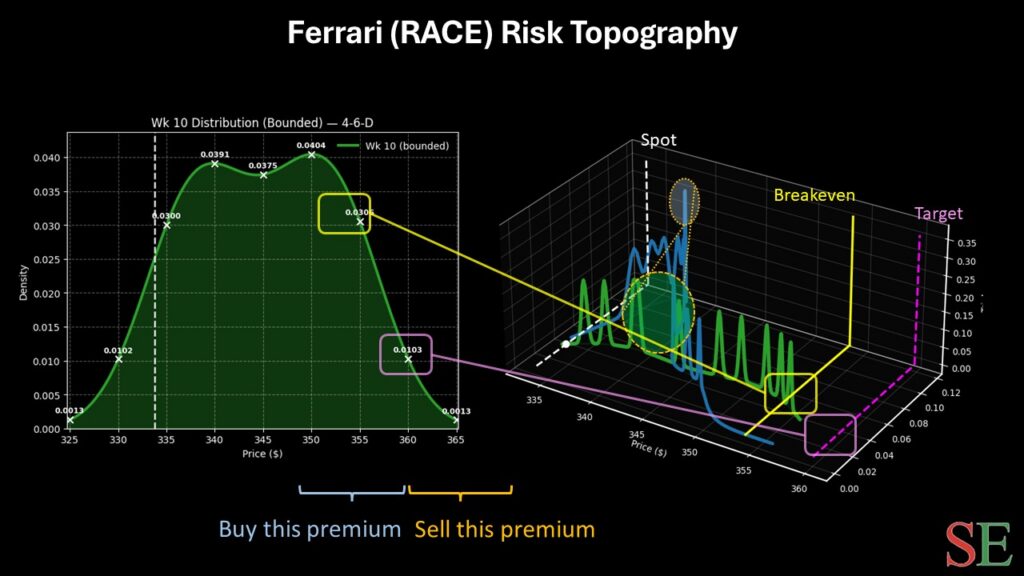
If you accept the premise above, the security’s forward 10-week returns would likely range between $325 and $365, with probability density peaking between $335 and $355. Should a positive surprise be the outcome, the volatility skew suggests that RACE stock could see a pronounced leap forward.
Thanks to this market intelligence, the 350/360 bull call spread expiring March 20 may be an attractive idea for aggressive speculators. This wager requires RACE stock to rise through the $360 strike at expiration, which is an ambitious target. If the security does trigger this level, the maximum payout would be over 156%.
Breakeven comes in at $353.90, improving the trade’s probabilistic credibility.
Leave a Reply