
Palo Alto Networks (NASDAQ:PANW) finds itself in awfully strange circumstances: offering critical cybersecurity services while PANW stock suffers a sizable downturn. Since the beginning of the year, the security has lost more than 10%. In the past 52 weeks, it’s down nearly 16%. Nevertheless, the upcoming fiscal second-quarter earnings report — scheduled for a Feb. 17 release — provides an opportunity to help right the ship.
Table of Contents
Wall Street analysts anticipate that earnings per share will reach 76 cents on revenue of $2.58 billion. In the year-ago quarter, the cybersecurity giant posted EPS of 81 cents on revenue of $2.26 billion, beating out the consensus targets of 78 cents and $2.24 billion, respectively. Overall, Palo Alto tends to deliver impressive results. Since at least February 2021, the only blemish has been a top-line miss for Q4 2023.
It’s not that the market doesn’t recognize PANW stock as a core investment. Over the past five years, the security has gained 151%. But since May 2024, the company’s market value has been largely flat, punctuated by choppy trading in the middle of the range. Obviously, the hope is that the general public realizes the broader importance of Palo Alto.
Yes, it’s completely understandable that frontline tech companies like Nvidia (NASDAQ: NVDA) garner both the praise and the headlines. However, cybersecurity has always kept the lights on within the digital ecosystem. As artificial intelligence becomes more powerful — and thus leveraged for nefarious purposes — defensive systems will likely only rise in relevance, not diminish.
As such, PANW stock is almost a no-brainer buy. If you anticipate that the selloff may be overextended, the contrarian position may be enticing and possibly discounted.
Volatility Skew Reveals the Inside Baseball for PANW Stock
One of the most important first-order (observational) analyses to consider is volatility skew. Volatility skew is a screener that identifies implied volatility (IV) — or a stock’s potential kinetic output — across the strike price spectrum of a given options chain. For the Feb. 20 expiration date, the prioritization among smart money traders is downside insurance.
Most prominently, put IV on the lower strike boundaries rises sharply higher and above its call equivalent. This setup indicates that a key concern among options traders and institutional investors is downside tail risk. By buying far out-the-money puts, these transactions effectively serve as southbound volatility insurance — and entities are willing to pay a pretty premium for the protection.
On the upper boundaries, put IV is also elevated relative to call IV. This structure implies the crafting of a mechanical short position, possibly to protect actual long exposure to PANW stock. However, the bigger point may come from information by omission. Call IV is generally flat from the at-the-money strike all the way to the upper boundaries.
Basically, we’re looking at a situation where there is practically no urgency for upside convexity. It’s not that the smart money doesn’t believe upside is possible. Rather, the setup is saying that the perceived risk of downside is of a far greater magnitude than the reward to the upside.
I’m not one to arrogantly proclaim that the smart money is wrong here. But because of the extended underperformance of PANW stock — where it’s down about 6% in the past six months — I believe a surprise upswing would lead to a greater magnitude movement.
Either way, because the prioritization is for puts, the calls are relatively cheap on a volatility basis. They could also be considered a discount if a legitimate reason exists to buy them.
Establishing the Trading Parameters of Palo Alto Networks Stock
While we now have a general understanding of smart money sentiment from the volatility skew, we’re still at a loss as to how this translates into actual price outcomes. For that, we may turn to the Black-Scholes-derived expected move calculator. Wall Street’s standard mechanism for pricing options projects that for the Feb. 20 expiration date, Palo Alto Networks stock may land between $152.04 and $178.74.
Where does this dispersion come from? Black-Scholes assumes a world where stock market returns are lognormally distributed. Under this framework, the above range represents where PANW stock may symmetrically land one standard deviation away from spot (while accounting for volatility and days to expiration).
Essentially, what the model teaches us is that in 68% of cases, we would expect PANW stock to trade somewhere within the prescribed range in nine days. That’s a reasonable assumption, if only because it would take an extraordinary catalyst to drive a security beyond one standard deviation from spot. Still, we’re left with a rather sizable peak-to-trough range of almost 18%.
At this juncture, we have largely reached the utility of first-order analyses. We know what the smart money may be thinking and how this could translate into an actual dispersion. However, we only really know the pricing of uncertainty — not whether that pricing is “appropriate,” for lack of a better phrase.
In other words, we’re faced with the classic search-and-rescue (SAR) conundrum. Black-Scholes has identified a distress signal somewhere in the Pacific Ocean, and the expected move calculator provides a search radius. Unfortunately, we live in a world of limited resources (and daylight). Therefore, we can’t always dedicate a full-on search for every single shipwrecked survivor incident.
Essentially, we would need the help of a second-order (conditional) analysis to find where the survivor might have drifted to — and that’s where the Markov property comes into view.
Using Science to Narrow Down the Probability Space
Under Markov, the future state of a system depends entirely on the present state. Colloquially, forward probabilities should not be calculated independently but should be assessed in context. Regarding the SAR analogy, different ocean currents — such as choppy waves versus calm waters — can easily influence where a shipwrecked survivor is likely to be found.
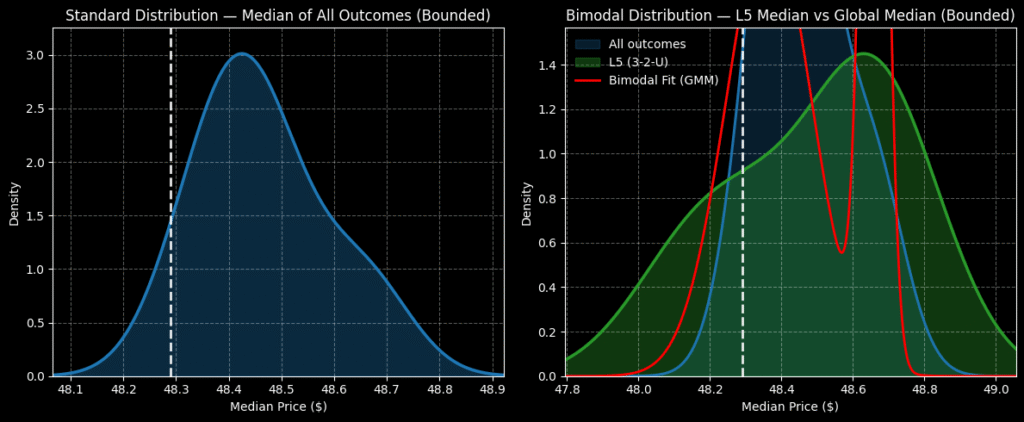
Here’s how the Markov property is relevant for PANW stock. In the last five weeks (I’m tightening the parameters of my trading model), Palo Alto printed only one up week, leading to an overall downward slope. There’s nothing special about this 1-4-D sequence, per se. However, this quantitative signal represents a unique ocean current, which should, by logical deduction, lead to a unique drift pattern.
Through enumerative induction and Bayesian-inspired inference, we can estimate the typical drift associated with the 1-4-D sequence. We then juxtapose this inference onto the current spot price to calculate a forward five-week distribution.
Of course, inductive models aren’t perfect because, philosophically, there’s no compelling reason why the future is necessarily compelled by past observations (per David Hume). Still, from an operational perspective, induction is one of the best tools we have.
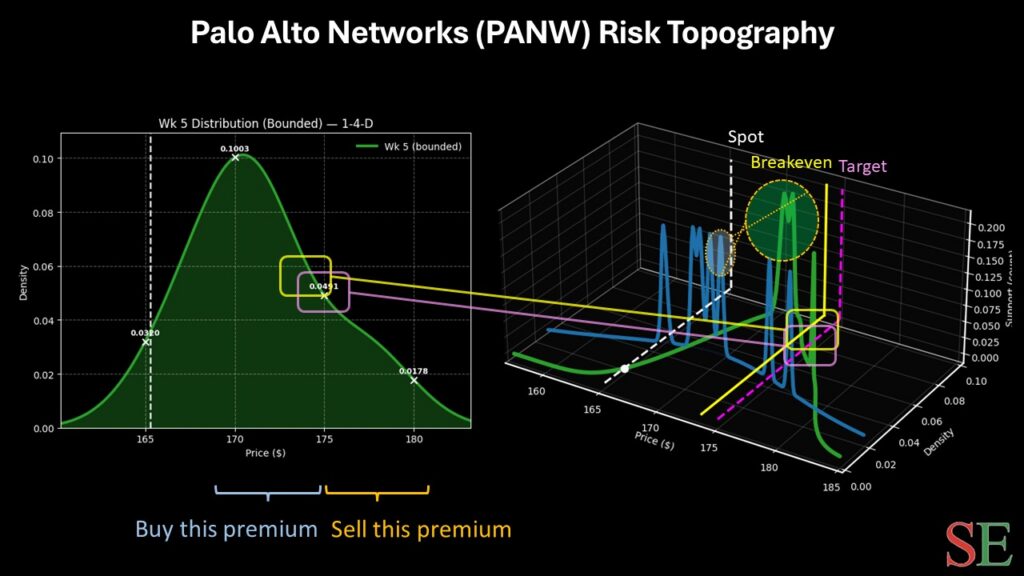
Assuming that you accept the premise, the forward five-week returns of PANW stock will likely land between $160 and $185, with probability density peaking near $170. This gives us a much narrower target to aim at.
With the market intelligence above, I’m tempted by the 172.50/175 bull call spread expiring Feb. 20. This wager requires a net debit of $115, which is the most that can be lost. Should PANW stock rise through the $175 strike, the maximum profit would be $135, a payout of over 117%. Breakeven lands at $173.65, improving the trade’s probabilistic credibility.
Leave a Reply