
Cleveland-Cliffs (NYSE:CLF) represents one of the more perplexing enterprises soon scheduled to release its latest financial disclosure. While the steel manufacturer is an integral component of the broader economy — and should, in theory, benefit from the Trump administration’s pro-America push — it also faces a critical credibility test.
Table of Contents
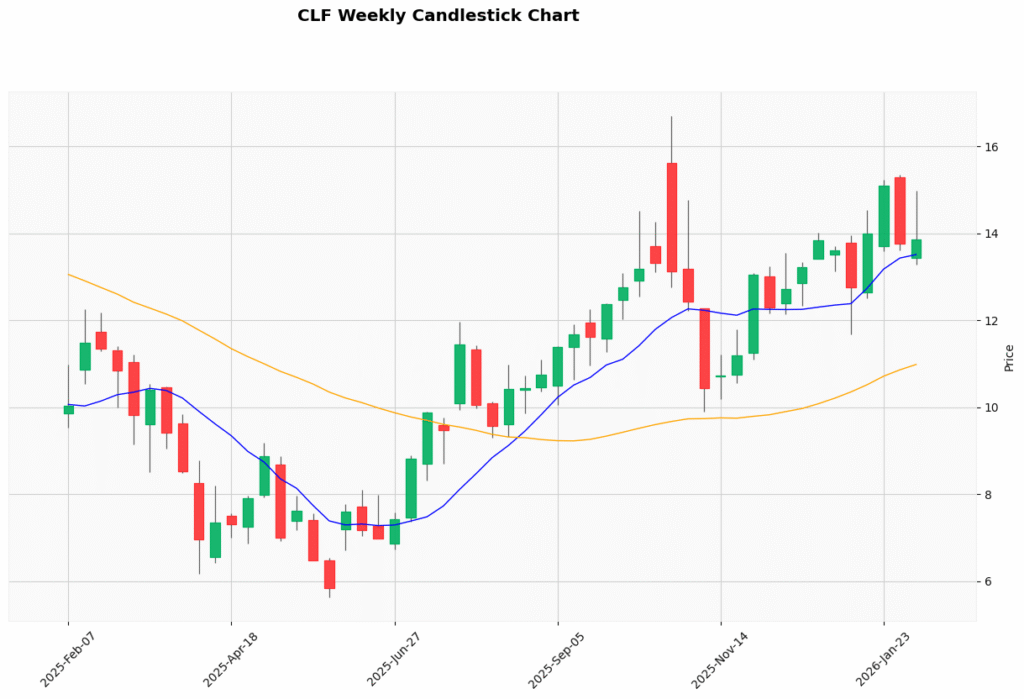
So far, CLF stock has been delivering the goods. Since the beginning of the new year, the security has gained over 4%. While this figure isn’t impressive by itself, there are plenty of previously high-flying tech companies that would love such a print. What’s more, in the past six months, CLF has swung up to the tune of nearly 48%.
However, it’s also reasonable to wonder whether the good times can keep rolling. Technically, this narrative came under heavy fire in late October last year, when CLF stock failed to convincingly break past the $14 resistance level. At the current juncture, CLF is again facing resistance at $14, which naturally raises the stakes for the steel manufacturer’s fourth-quarter earnings report, scheduled for release on Monday before the open.
Analysts are looking for a loss per share of 62 cents on revenue of $4.6 billion. In the year-ago quarter, Cleveland-Cliffs posted a loss per share of 68 cents on revenue of $4.33 billion. These results missed the consensus target of 78 cents in the red and $4.43 billion, respectively.
If we were judging Cleveland-Cliffs stock simply on exceeding financial expectations, past circumstances don’t paint a compelling picture. Top-and-bottom-line beats are hard to come by for the steel company, with Q2 2025 being the latest rare example.
Nevertheless, what’s interesting here is that the smart money appears to be prioritizing optimism expression in the options market.
Using Volatility Skew to Gauge Smart Money Sentiment for CLF Stock
One of the most insightful first-order analyses in the financial market is volatility skew, a screener that identifies implied volatility (IV) — a stock’s potential kinetic output — across the strike price spectrum of a given options chain. For the Feb. 13 expiration date, the prioritization among sophisticated market participants is upside optionality.
On both ends of the strike price spectrum, call IV is priced higher than put IV — in some cases, noticeably so. This dynamic indicates that traders fear being exposed to upside risk than downside. With the deeper in-the-money (ITM) calls, the positioning potentially reflects institutional investors’ balance-sheet flexibility of synthetic exposure to CLF stock rather than outright ownership.
Looking at the further out-the-money (OTM) calls, the positioning here potentially represents the belief that a strong upswing is a non-trivial risk. Put IV is relatively muted at the upper strike boundaries, which reaffirms the motif of upside optionality.
It’s important to mention here that the smart money is labeled as such for its transactional sophistication rather than directional prescience. Frankly, it would be a risk to constantly bet on what you think the smart money is doing.
Remember, volatility skew is a first-order analysis, which in part means that it’s a standard methodology that’s available to anyone. It’s not a privileged black box mechanism. Stated differently, the information that I just shared with you has likely been embedded into the CLF stock price.
Moreover, sophisticated traders prioritize expected value over attempting to guess where a security may head next. So, the Feb. 13 volatility skew isn’t necessarily saying that the smart money is outright bullish on CLF stock. Rather, the skew is saying that the cost of not being positioned for upside is greater than missing out on a trade to the downside.
Why is that? Like I said earlier, Cleveland-Cliffs has a poor earnings track record so the general vibe is that results won’t be all that hot. However, if the company manages to positively surprise, the resultant upswing could be much more robust than if CLF collapses following a mundane performance.
What I’m worried about, then, is that the calls could be cynical.
Establishing the Trading Parameters of Cleveland-Cliffs Stock
While we may have an understanding of what the smart money may be thinking, we’re still at a loss as to how this translates into actual output. For that, we can turn to the Black-Scholes-derived expected move calculator. Wall Street’s standard model for pricing options forecasts a range between $11.54 and $16.14 for the March 20 expiration date.
Where does this dispersion come from? Black-Scholes assumes a world where stock market returns are lognormally distributed. Under this framework, the above range represents where CLF stock may symmetrically fall one standard deviation away from spot (while accounting for volatility and days to expiration).
In effect, Black-Scholes is saying that in 68% of cases, we would expect CLF stock to trade between roughly $12 and $16 over the next 43 days. Mathematically, this assumption is reasonable as it would take a mighty big catalyst to drive a major security like CLF more than one standard deviation. Still, we’re left with a list of possibilities rather than probabilities.
Effectively, we have now reached the absolute limit of insights that are possible with first-order analyses. Anything more will require either hand-waving (that is, declaring an argument by fiat) or a second-order analysis.
Imagine that CLF stock is a shipwrecked survivor. Black-Scholes has identified that the SOS signal went out somewhere in a big patch of the Pacific Ocean. While that’s valuable information, as an officer of a search-and-rescue (SAR) team, you only have so many resources to dedicate to a single missing person.
What do you do? You have to use a second-order analysis that integrates influencing elements — particularly ocean currents — to help probabilistically determine where you actually might be, rather than where you could be if physics were turned off (Black-Scholes).
This is where the Markov property comes into full view.
Using Science to Trade CLF
Under Markov, the future state of a system depends entirely on the present state. Colloquially, forward probabilities should not be calculated independently but be assessed in context. Regarding the SAR analogy, different ocean currents — such as choppy waves versus calm waters — can easily influence where a shipwrecked survivor is likely to be found.
This logical framework explains why I categorize price action into discretized sequences. For example, in the last 10 weeks, CLF stock printed seven up weeks, leading to an overall upward slope. There’s nothing special about this 7-3-U sequence, per se. However, this quantitative signal represents a specific type of ocean current — and therefore, it will likely impact where CLF may drift over the next 10 weeks.
Let’s step back for a moment. Admittedly, no law exists that trends must continue based on prior observations. However, with the lack of any other workable solution (without going into advanced theories), enumerative induction, combined with Markov state transitions, represents potentially the best second-order analysis to whittle down uncertainty.
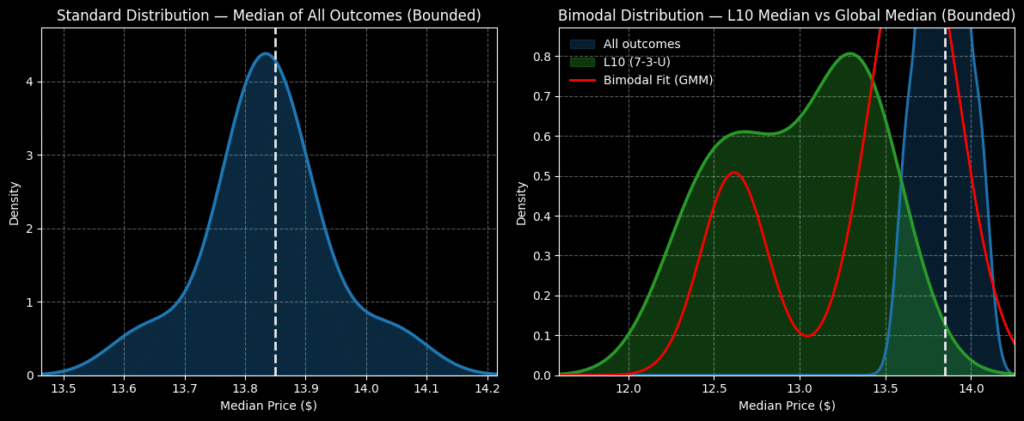
Over the next 10 weeks, using the inductive Markovian approach, we can calculate that CLF stock may land between $11 and $15, with probability density peaking between $13 and $13.50. Primarily, the key point here is that while CLF generally features a neutral bias in aggregate conditions, under 7-3-U conditions, the bias shifts negatively.
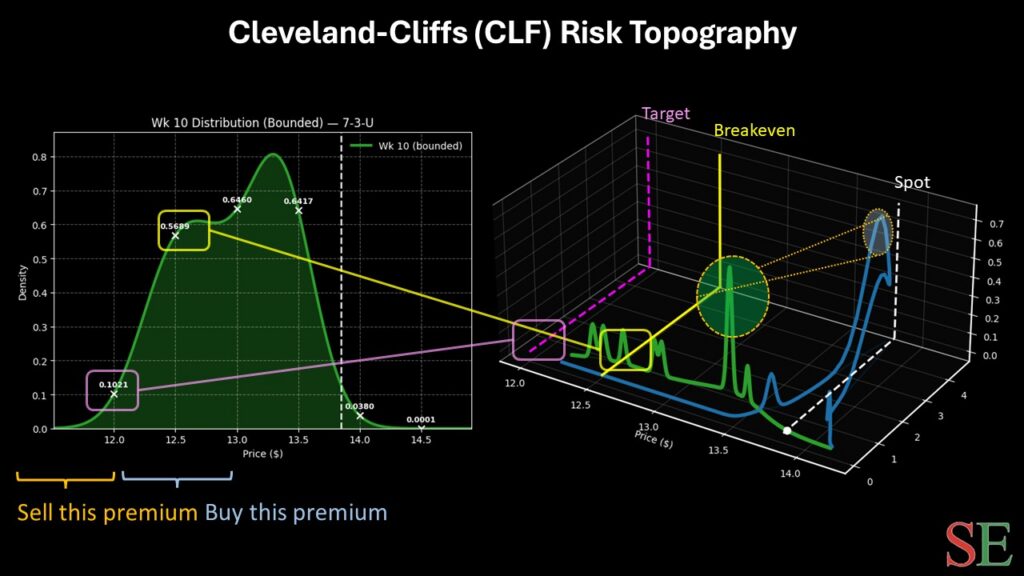
Subsequently, investors should be careful about reading too deeply regarding smart money transactions. While a surprise upside move could be more robust, the quantitative structure appears to favor the downside trajectory.
Those who are more aggressively speculative may consider the 13/12 bear put spread expiring March 20. Should CLF stock fall through the $12 strike at expiration, the maximum payout would be over 122%. While the second-leg strike is an ambitious target, the breakeven price for this trade comes in at $12.55, making the trade more probabilistically palatable.
Leave a Reply