
SoFi Technologies (NASDAQ:SOFI) faces a critical test ahead of a key financial disclosure. Although the financial technology giant has garnered incredible popularity, especially with younger demographics, it’s fair to say that the platform hasn’t gotten off to a particularly auspicious start to the new year. Since the beginning of January, SOFI stock is down 6%.
Table of Contents
To be fair, the recent performance shouldn’t overshadow the bigger picture, where the security has gained over 52% in the past 52 weeks. However, if we’re going to be honest about framing, it must be said that recent sentiment metrics raise serious concerns. For example, in the trailing six months, SOFI stock has managed to move up less than 10%.
Heading into the company’s fourth-quarter earnings report — scheduled for Jan. 30 before the opening bell — the fintech brand is struggling for confidence. Analysts will be looking for earnings per share to hit 12 cents on revenue of $982.19 million. In the year-ago quarter, the bank delivered EPS of 5 cents on revenue of $739.11 million, beating out the consensus view of 4 cents and $682.2 million, respectively.
Overall, SoFi’s print has been impressive. Since August 2021, the company has always exceeded its top-line target. Further, it has never missed against bottom-line expectations. Based purely on statistical induction, it would take a bold wager to say that SoFi will break this trend in the upcoming Q4 report.
Of course, no one can say with absolute certainty what will happen prior to the disclosure. However, if the options market is anything to go by, the smart money seems cautiously optimistic about SOFI stock.
Volatility Skew Broadcasts an Intriguing Signal for SOFI Stock
Irrespective of your intended goals in the market, it’s always a good idea to consider the volatility skew of the optionable securities that you’re interested in. This screener identifies implied volatility (IV) or a stock’s potential kinetic output across various strike prices for a specific options chain.
For example, the volatility skew for SOFI stock for the Feb. 20 expiration date shows call IV being priced significantly higher than put IV in the lower price boundaries. On the upper strike price boundary, both call and put IVs are relatively muted, though there is a hint of put IV rising modestly above calls in the upper reaches.
The above dynamic reveals two main themes. First, the higher call IVs that are deep in the money (ITM) — that is, the lower strike prices — may reflect controlled optimism. In other words, it appears that the most sophisticated market participants want upside exposure and optionality for SOFI stock but on a synthetic basis. By paying a premium for the calls (instead of owning 100 shares per contract), these traders preserve capital flexibility.
On the other end, the reduced IVs for both calls and puts on the upper strikes suggest that there isn’t much emphasis on protective tactics. To clarify, this shouldn’t be interpreted as saying downside isn’t possible. But it can be reasonably inferred that the smart money doesn’t believe that extreme downside is a likely outcome.
If anything, net sentiment — given the volatility skew favoring deep ITM calls — for SOFI stock appears to be one of cautious optimism. Perhaps the most important takeaway is that traders are not outright dumping SOFI despite its recent poor performance. Instead, they’re very much engaging in the narrative.
Even better, the quantitative framework suggests that there’s justification for this optimism.
Narrowing Probabilities Through a Second-Order Analysis
According to the Black-Scholes-derived expected move calculator, the anticipated dispersion for SOFI stock for the Feb. 20 options chain is between $21.57 and $27.83. This forecast represents a 12.67% high-low spread relative to the current spot price, reflecting in part a heightened IV of 68.25%.
Where did this dispersion come from? Essentially, Black-Scholes assumes that stock returns follow a lognormal distribution. Therefore, the aforementioned range represents where SOFI stock would land symmetrically one standard deviation away from the spot price (while accounting for volatility and days to expiration).
Without getting bogged down with the math, Black-Scholes is saying that in 68% of cases, SOFI stock should be trading between roughly $22 and $28 at the end of the Feb. 20 session. While the assumption is reasonable — since it would take a gargantuan catalyst to move a security beyond one standard deviation — we have a huge problem: we don’t know within the dispersion where SOFI is likely to touch ground.
To get a range of probabilities (and not just possibilities), we can turn to a second-order inductive analysis using the Markov property. Under Markov, the future state of a system depends solely on the current state. That’s a fancy way of saying that forward probabilities should not be independently calculated but rather assessed taking into account context.
To use a simple football analogy, a 20-yard field goal is an easy chip shot. Add snow, wind and playoff pressure, and these odds may change dramatically.
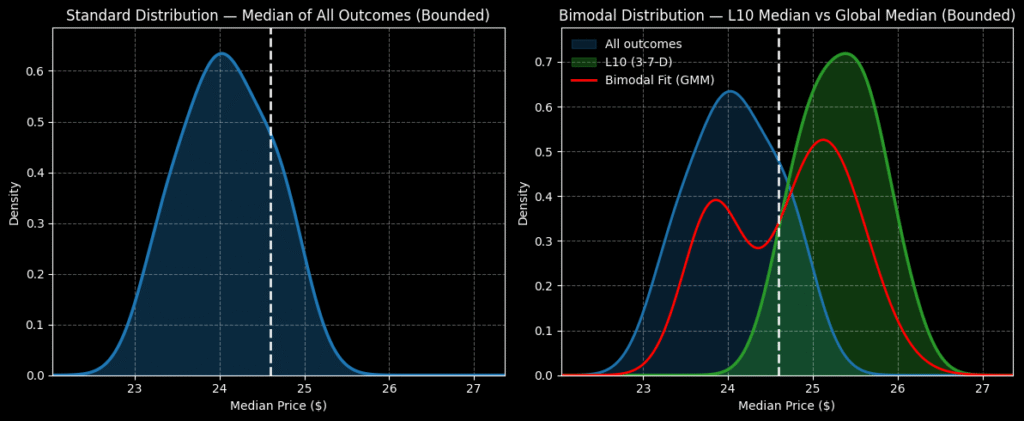
What’s the current quantitative context of SOFI stock? Ahead of the Q4 earnings report, SOFI has printed only three up weeks, leading to an overall downward slope. Under this 3-7-D condition, the security’s forward-10-week returns would be expected to land between $24 and $27. That’s significant because under everyday aggregate conditions, the range would be expected to land between $22 and $26.
In other words, under normal circumstances, SOFI stock features a negative bias. Under the context of the 3-7-D quant signal, the general expectation is an upward bias.
Going by the Numbers
Continuing with the inductive process, from the first week to the fifth week, we would expect peak probability density to gyrate somewhere between $24.90 and $25.75. Obviously, the unknowns surrounding the upcoming Q4 report add significant variability to the mix. However, if we were strictly following the data inductively, the $25 price zone would probably be the main anchor.
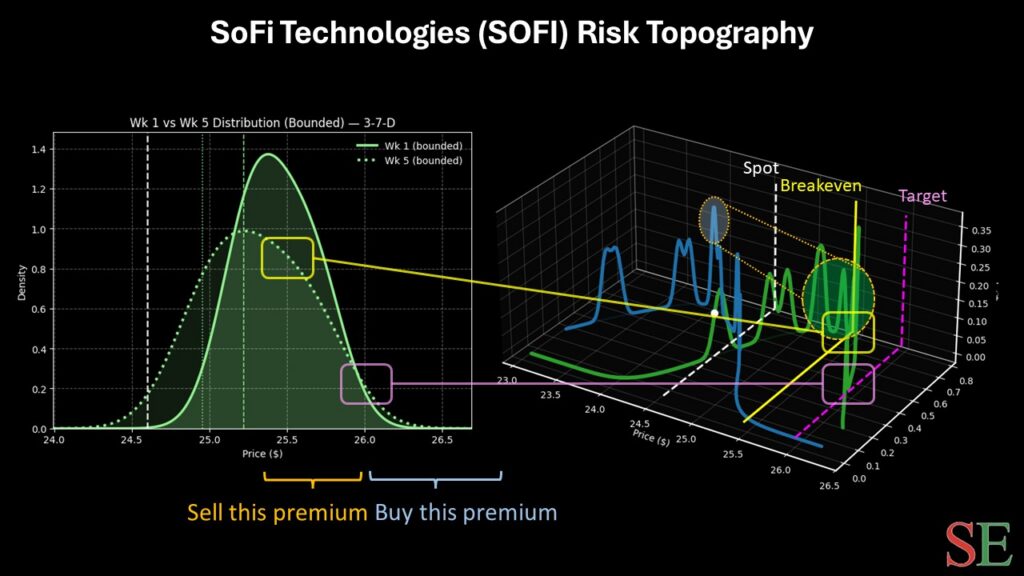
With that being the case, the 25/26 bull call spread expiring Feb. 20 arguably generates intrigue. For a $47 net debit, the trader is betting that SOFI stock can rise through the $26 strike, which represents the upper boundary of the 3-7-D signal’s forward distribution. If successful, the maximum profit would be $53, a payout of nearly 113%.
Breakeven lands at $25.47, which is near peak probability density of the aforementioned quant signal. This call spread allows traders a reasonable chance of protecting their capital while also stretching for a sizable payout.
Leave a Reply