
D.R. Horton (NYSE: DHI) will almost certainly attract significant attention when it releases its fiscal fourth-quarter earnings results, scheduled for Jan. 20 before the opening bell. In the prior quarter, the homebuilder posted sales of $9.68 billion, beating out the consensus target by 2.7%. However, adjusted operating income and EBITDA fell well short of expectations, sparking a downturn in DHI stock.
Table of Contents
For the upcoming disclosure, analysts expect revenue to decline 12.4% year-over-year to $6.67 billion. On the bottom line, Wall Street experts are forecasting a print of $1.92 per share. Given the current economic challenges — particularly stubbornly high inflation relative to the pre-pandemic paradigm and the impact of tariffs — investors don’t exactly have high hopes for the homebuilding industry.
That said, the reduced expectations could be a blessing in disguise. Essentially, the market doesn’t price facts themselves; it prices changes in facts or shifting expectations of facts. Therefore, if investors collectively believe that circumstances are better than previously advertised, it wouldn’t be surprising if DHI stock were to swing higher.
Keep in mind that since the close of the Sept. 8 session, D.R. Horton stock is down more than 15%. In order for shares to continue dropping further, there needs to be fresh justification. A garden-variety poor print might not do the trick, as analysts are already expecting a deterioration in the top line.
If we’re looking at the canvas from a naïve probabilistic perspective, there appears to be a higher risk of DHI stock not falling further. In fact, the structural case appears to support the bullish narrative.
First-Order Expectations for DHI Stock
With D.R. Horton set to release earnings results shortly, it’s no surprise that implied volatility (IV) for the next weekly options chain (expiring Jan. 23) has witnessed a spike to 63.44%, which is higher than other nearby chains. A residual metric stemming from actual order flows, IV is one of the strongest expectational metrics you’ll use as a trader.
Imagine that you’re standing next to the roadway. As cars zip past you, you’ll hear the “whoosh” as the passing vehicles disrupt the surrounding air. While you obviously don’t know the ultimate destination of these cars, you can estimate by the aural quality of the sound how fast they’re driving. That estimation is basically IV.
In the equities market, when IV is elevated relative to historical norms, that’s a signal that options traders anticipate a large kinetic movement. A massive IV figure doesn’t mean bullish or bearish; it just means that traders are betting on (and hedging against) an outsized performance.
By taking the IV figure and plugging it into the Black-Scholes formula, traders are able to estimate a forward dispersion for a selected options chain. For example, the IV for the March 20 options chain comes in at 39.44%. When plugging this volatility figure into the aforementioned framework, the expected move would be a high-low spread of 11.8%.
Based on the current market price, DHI stock would be expected to land between $137.40 and $174.17. This is the basis of the so-called “expected move calculator” and there are several financial outlets that are selling this insight for a premium subscription.
If you want my advice? Save your money. The expected move calculator is the question, not the answer.
It’s not that the calculator is wrong. Again, IV is a real residual metric. So, when the market is expecting a range between $137.40 and $174.17 for the March 20 options chain, that’s a legitimate target. The issue is that the total gap between these two price points is nearly 27%.
I’m sorry, but that’s a massive cavern, which means that trading straddle-type strategies would entail unnecessary cost or risk exposure. In other words, there’s no point in betting on an outcome if we have a reasonable likelihood to believe that it won’t materialize.
That’s where the Markov property enters the arena.
Narrowing the List of Possibilities for D.R. Horton Stock
Calculating forward probabilities should never be an exercise done in isolation because everything is contextual. Under the Markov property, a system’s future (behavioral) state depends only on the current state. To use a simple sports analogy, the chance of you winning a game could be 50/50. However, if you have a massive lead late in the game, the odds could be 90/10 in your favor.
One of the critical vulnerabilities of the Black-Scholes model is that the underlying math isn’t integrated with the capability of carrying over prior context. So, whether a stock is on a winning streak or a losing streak, it doesn’t matter. The probabilities that are spit out in this model are largely dependent on IV.
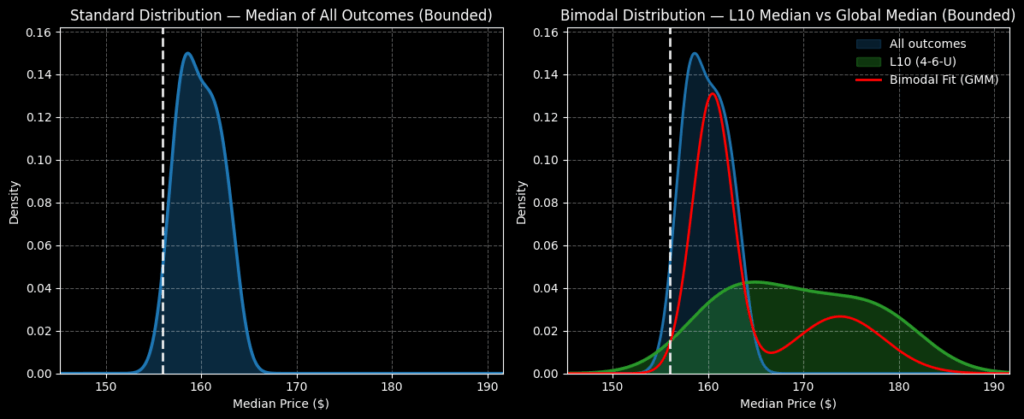
With Markov frameworks, we always take into account prior context. In the case of DHI stock, in the last 10 weeks, it printed only four up weeks but with an overall upward slope. This rare contrarian signal tends to resolve even higher over the next 10 weeks. Specifically, if we assume a spot price of $155.96 (Friday’s close), DHI should land between $145 and $192.
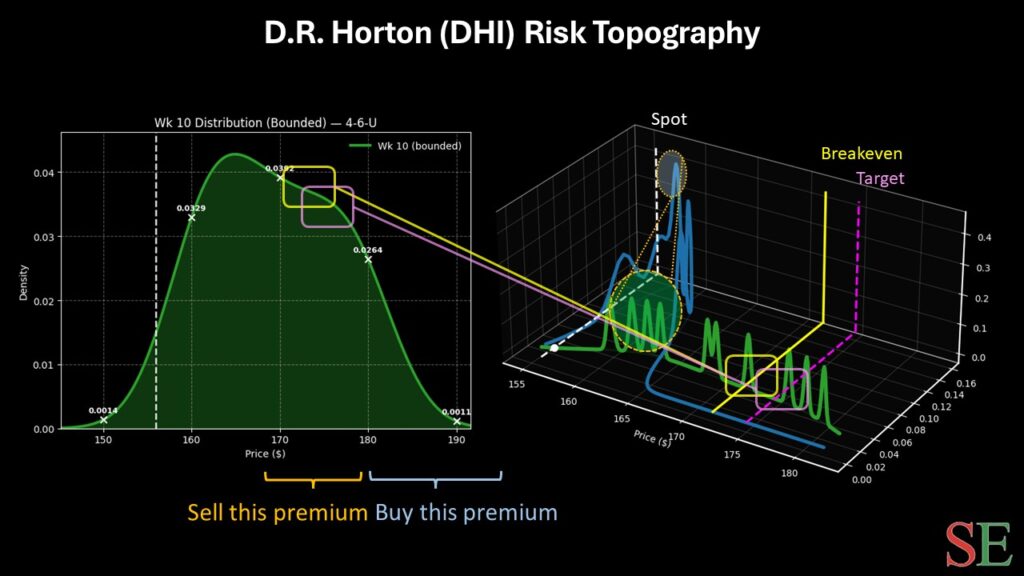
However, the real second-order analysis comes in the form of probability density. Over many trials of the 4-6-U sequence, probability density would likely peak between $159 and $179. That’s a much narrower range of likely outcomes than the Black-Scholes-calculated range between $137.40 and $174.17.
Given this market intelligence, I’m liking the 170/175 bull call spread expiring March 20, 2026. This wager involves two simultaneous transactions: buy the $170 call and sell the $175 call, for a net debit paid of $200 (the most that can be lost).
Should DHI stock rise through the second-leg strike ($175) at expiration, the maximum profit would be $300, a payout of 150%. Further, breakeven would land at $172, thereby enhancing the trade’s probabilistic credibility.
Leave a Reply