
With little question that cryptocurrencies and the underlying blockchain technology represent a paradigm-altering transformation, you would think that Coinbase Global (NASDAQ: COIN) — a premier exchange and digital wallet service — would rank among the top publicly traded innovators. However, the opposite is true. Since its equities market debut, COIN stock has dropped about 29%. That’s hardly a cause for celebration.
Table of Contents
Making matters worse, investors typically have to depend on fortuitous timing — both on the entry and exiting side — to consistently generate positive returns. Otherwise, long-term holds have not been Coinbase’s forte. As an example, investors who have held COIN stock over the past 52 weeks would be absorbing a loss of nearly 13%.
In contrast, the vanilla S&P 500 index over the same frame is up a little over 14%. As things stand, COIN stock suffers a 60-month beta of 3.69. Basically, exposure to Coinbase translates to almost four times the volatility experienced by the benchmark index.
For investors who prefer stable businesses and steady, compounding growth, COIN stock is the equivalent of nightmare fuel. However, that doesn’t mean the wild kinetic behavior is entirely a liability. Sure, because Coinbase is inextricably tied to the blockchain ecosystem, the wildness is part and parcel of the underlying narrative.
Still, Wall Street doesn’t want you to know that you can systematically use price swings to make structured, rational trades.
Adapting to a New Framework of Market Analysis
In most analytical frameworks involving the financial markets, price or value is plotted as a function of time. Put simply, as time passes, a corresponding entry of negotiated value is inputted on a chart. However, this approach simply lays out the chronological history of the market. Therefore, if you pull up a technical chart from one source, it’s going to be identical to another — there’s no new information available.
A point that often gets lost, though, is that price is truly meaningful when it’s treated as a function of state. Unfortunately, we don’t know what that state is as it would encompass a gazillion variables. That’s why I’m not a big proponent of fundamental analysis, even though the methodology is treated as the gold standard. In this approach, forward prices are projected from future earnings or cash flow estimations.
The problem? There’s no clean, causal relationship between earnings or cash flow and the target share price. If that were the case, every public company that delivered strong earnings results would see their valuations rise. In fact, many times, we see valuations fall following robust results.
That should never happen if the causal relationship asserted by fundamental analysis was consistently meaningful. It’s not. We see the discontinuity every single earnings cycle.
To understand the market, we need to identify the structure or geometry of risk. As far as I’m aware, this structure can only be revealed through fixed-time distributional analysis.
Let’s consider a single 10-week cycle of COIN stock. If we were to take the return of this period, it would not be particularly meaningful if we wanted to know the odds of how the other weeks in the dataset would perform. But what if we were to take hundreds of these 10-week cycles and stack them atop each other in a fixed-time distribution?
Suddenly, we would have new information from the same old price chart that everybody is looking at.
Obviously, one-off events wouldn’t mean much due to a lack of volume. However, frequently consistent behavior would see deeper entrenchment at certain price levels over others, creating a bulge in the distribution.
This bulge is probability density — essentially the point in the fixed timeframe where COIN stock coalesces. If we aim there, we should theoretically have a greater chance of success.
Trading the Risk Geometry of COIN Stock
Using a distributional analysis with a fixed 10-week horizon, the medina nominal returns of COIN stock will likely range between $238 and $252 (assuming an anchor price of $244.19, Wednesday’s close). Price clustering would likely be predominant at $243.80, which indicates a neutral to slightly bearish bias.
However, we’re not as interested in the aggregate distribution of COIN stock but rather the current quantitative signal, which is the 3-7-D sequence; that is, in the past 10 weeks, COIN printed only three up weeks, leading to an overall downward slope.
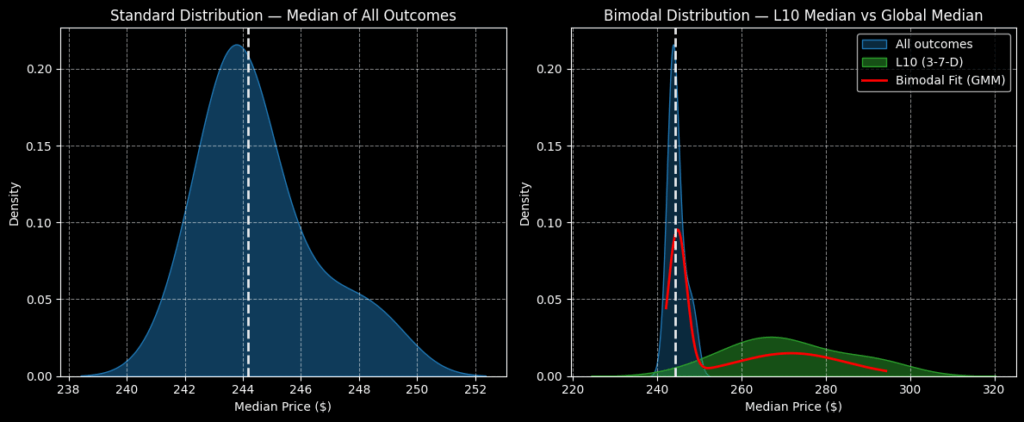
On paper, this bearish-pressure-heavy sequence would seem to have negative implications. However, over the next 10 weeks, the distributional curve of the 3-7-D sequence would likely range between $220 and $320. Moreover, price clustering would likely be predominant at roughly $265.
In other words, the 3-7-D signal usually sparks buy-the-dip sentiments. As such, speculators are incentivized — assuming they have strong conviction in the empirical premise laid out — to consider a contrarian bullish position.
What’s more, calculating the risk geometry of COIN stock involves more than understanding where the security wants to coalesce over many trials. Instead, it’s also useful to identify where probability decay accelerates.
Notably, between $260 and $280, decay is relatively mild, with probability density only declining by 19.91%. However, from $280 to $300, density stumbles by a stunning 62.71%. From $300 to $320, the situation gets even worse, with the metric falling 98.48%.
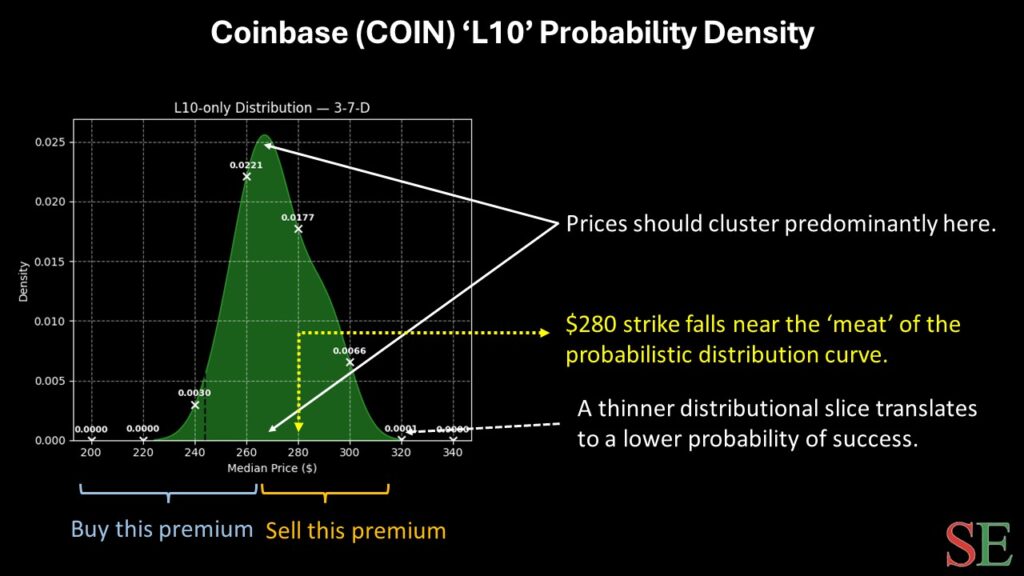
What does this risk geometry tell us? Basically, from the anchor to about $280, probability density stands on relatively high ground, thus providing some confidence for bullish speculators. Beyond that, the likelihood of upside success diminishes rapidly.
Considering this market intelligence, arguably the most prudent trade is the 270/280 bull call spread expiring Feb. 20, 2026. This trade requires COIN stock to rise through the second-leg strike ($280) at expiration. If it does, the maximum payout lands at over 198%.
Being Bullish the Practical Way
Thanks to the calculation of risk geometry, we immediately recognize that there’s realistic upside potential from here to the $280 level. While price points above this line are possible, the empirical data shows that the odds of reaching such peaks fall quite precipitously. As such, it’s better to consider a limited-risk, limited-reward strategy to bet on the outcome that’s likely — and sell the rest of the distribution.
Leave a Reply